Abstract:
The increasing frequency of urban flooding, driven by rapid urban growth and climate change, has exposed the limitations of conventional flood control infrastructure. As a result, cities worldwide—particularly in developing nations such as Bangladesh—are shifting toward integrated planning and adaptive design strategies to cope with these challenges. In Dhaka, one of the most flood-prone cities, street networks are among the first urban systems to be disrupted by flooding. While existing research has largely focused on topographical analysis or traffic-related vulnerabilities, there is limited insight into how flood events affect the functional performance of street networks and how design responses can enhance resilience. This study explores the comparative value of flood prevention versus flood adaptation through a localized analysis of Dhaka’s road network. Utilizing spatial network analysis via sDNA and flood data provided by the World Bank, this research investigates the structural and functional changes in street networks before and during flooding. The analysis, visualized through GIS and network modeling, reveals spatial patterns of vulnerability and resilience, proposing alternative design strategies tailored to Dhaka’s unique urban fabric. The findings aim to inform more robust planning frameworks, equipping city authorities with practical, strategic tools for both immediate response and long-term adaptation in the face of recurring floods.
Keywords: Urban flood resilience, Adaptive design, Inundation response, sDNA, Spatial network modeling, Dhaka
Introduction
Flooding stands as one of the most widespread and destructive natural disasters globally, with urban areas bearing the brunt of its impact (Ashley et al., 2007; Dewan, 2013). Despite extensive investments in flood control infrastructure—such as levees, dams, diversion channels, and pumping stations—cities continue to experience growing vulnerability to flood events (Andersen & Marshall Shepherd, 2013). Many urban centers are located in flood-prone areas, particularly along coastlines or major rivers, making them inherently susceptible to inundation (Small & Nicholls, 2003; Ward et al., 2011). The risk is especially acute in developing countries, where rapid urban population growth outpaces infrastructure development, limiting the capacity to implement adaptive flood management strategies (Anunobi, 2013; Lindley et al., 2006). Factors such as unplanned urban expansion, land-use transformation, population density, and land subsidence—compounded by climate-induced phenomena like sea-level rise and increased rainfall—further intensify flood risk (Atreya et al., 2017; Bouwer, 2011). Traditionally, flood adaptation strategies have been more prominent in rural or semi-rural areas, where “living with water” is often embedded in development practices (Laituri, 2000). However, in recent years, both developed and developing nations—including Bangladesh—have faced severe flood events, with developing countries typically incurring greater economic and infrastructural losses (Haque, 2016). Nevertheless, some cities have made strides in implementing innovative flood resilience strategies, such as wetland restoration in the Mississippi Delta or urban design interventions in Boston, Rotterdam, and Lagos (W. et al., 2007).
Despite these advances, the impact of flooding on urban transportation systems—particularly street networks—remains under-researched (van Ginkel et al., 2021). Flood events compromise mobility, delay emergency response, and degrade urban infrastructure (Doll et al., 2014; Koks et al., 2019). In cities like Dhaka, intense rainfall and inadequate drainage systems lead to frequent flash floods, inundating roads and disrupting daily life. Often, roadways serve as unintended conduits for stormwater, amplifying traffic disruptions and damage to infrastructure. Yet, the specific consequences of flooding on urban road networks—especially in the context of developing cities—have not been adequately studied. Much of the current discourse on urban flood mitigation is limited to engineered solutions or landscape-based interventions (Dewan, 2013). The dominant flood-prevention paradigm needs to be re-evaluated in favor of more adaptive, resilience-oriented approaches (K.-H. Liao, 2014). While concepts such as “flood-resilient cities” or “living with floods” have been explored in rural areas, their application in dense urban environments like Dhaka remains scarce.
This paper proposes a forward-thinking approach to flood resilience that Dhaka’s urban communities can adopt to coexist with recurring flood risks. Given that road networks are among the first and most severely affected urban systems, this study seeks to answer two central research questions:
- How can the spatial impact of flooding on street networks be measured and visualized?
- What flood-resilient strategies can be derived from understanding this relationship?
The objectives of this study are threefold:
- To demonstrate the extent to which flooding affects Dhaka’s road network,
- To utilize spatial network analysis tools and flood data to analyze the relationship between roads and flood events, and
- To extract insights from this exploratory analysis that can inform future urban planning policies in Dhaka.
Finally, this study offers a framework that could guide both the redevelopment of existing flood-vulnerable areas and the planning of new developments—such as Uttara, Purbachal, and Savar—using resilient, adaptive urban design principles.
Literature Review
Flooding exerts significant adverse effects on urban road networks, with varying levels of disruption depending on road location and condition (Arkell & Darch, 2006). Traditional flood risk assessments often concentrate on the directly inundated areas, yet adjacent properties and road networks also experience considerable indirect consequences (Gil & Steinbach, 2008). Disruptions in transportation systems affect both journey time and commuter routes, and these changes can be evaluated by comparing pre- and post-flood network connectivity, often through simulation modeling. Street-level flooding results in reduced vehicular speeds and increased travel time. When water depth exceeds 300 mm, roads become impassable, halting traffic altogether (Arrighi et al., 2021). In extreme cases, entire areas can become isolated due to complete road inaccessibility. This is particularly critical for locations with limited access routes, such as peninsulas, where even emergency responses become severely constrained. The concept of flood resilience goes beyond mere flood prevention. It emphasizes a community or area’s capacity to withstand flood impacts while minimizing disaster risk. Resilience involves not only absorbing the physical and socioeconomic damage but also responding swiftly and effectively (K.H. Liao, 2012). An area’s flood tolerance is measured by its ability to remain operational and suffer minimal damage during flood events. In urban planning, resilience thinking has become an essential framework for addressing increasing risks and uncertainties tied to climate change and flood hazards. Adaptation, as defined in climate change literature, encompasses the strategies and measures adopted to adjust to both current and anticipated climatic conditions—including flood events (UNISDR, 2009; Wilby & Keenan, 2012). Importantly, the role of citizens in adaptation processes is increasingly recognized in contemporary flood management policies (Butler & Pidgeon, 2011; Johnson & Priest, 2008; Scott et al., 2013). However, modern urban lifestyles often conflict with traditional “living with floods” approaches, making it more difficult to implement adaptive strategies (Cuny, 1991; Thaitakoo et al., 2013; Zevenbergen et al., 2011). The literature suggests a growing shift from flood defense to flood risk management, where communities adopt a proactive stance. This paradigm encourages societies to adapt and coexist with water, embracing the reality of periodic floods as part of urban life rather than exceptional disruptions (Scott et al., 2013).
Street Network and Flood Vulnerability of Dhaka
Bangladesh is one of the most densely populated countries globally, home to approximately 167 million people within an area of just 148,460 km² (Worldometer, 2022; The World Bank, 2022). Its capital, Dhaka, ranks among the fastest-growing megacities in the world, with an annual population growth rate of 4.2% (Bangladesh Bureau of Statistics, 2022). This rapid urban expansion is largely driven by rural-to-urban migration, making Dhaka the residence of about 40% of the country’s urban population (Ahmed & Ahmed, 2017). Historically, Dhaka has developed in a highly unregulated and fragmented manner, resulting in intense competition for limited urban space (Figure 1) (Hasan et al., 2013).
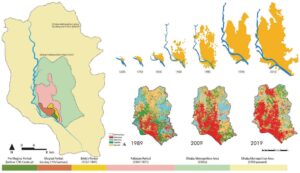
Figure 1 Development of Dhaka City
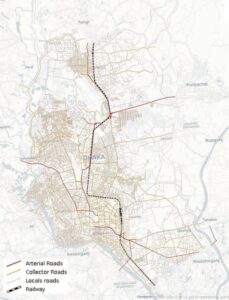
As the city’s population grows, so does the demand for transportation infrastructure—yet during flood events, even key roads are frequently submerged due to insufficient drainage systems. Due to economic constraints and the scarcity of available land, many people are compelled to settle in low-lying, flood-prone zones that lack formal protection. This unplanned urban growth has led to the destruction of natural floodplains and the obstruction of stormwater drainage paths, contributing to recurring floods, water scarcity, decreased groundwater recharge, biodiversity loss, and significant productivity losses caused by chronic traffic congestion. In a typical urban setting, roads occupy 20–40% of land area, depending on city size and function (Chowdhury, 2001). In stark contrast, Dhaka allocates only 9% of its land to roads (Figure 2), with just 6% used for pedestrian walkways within the Dhaka Metropolitan Area (DMA). Of the total 1,286 km of road infrastructure, only 61 km serve as primary roads. The remainder consists of 108 km of secondary roads, 221 km of connector roads, and 573 km of narrow local roads (Mahmud et al., 2009), highlighting the inadequate distribution and scale of Dhaka’s Street network.
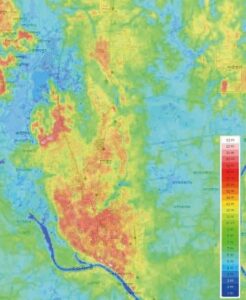
Topographically, most of Dhaka’s urbanized areas sit between 6 to 13 meters above mean sea level (msl) (Figure 3). The elevation of Greater Dhaka ranges from just 2 to 16 meters, with only 20 km² exceeding 8 meters in height (Mahmud et al., 2009). Conversely, roughly 170 km² of the area lies below 6 meters in elevation, making it highly susceptible to flooding (JICA, 1991). The city’s flat terrain, coupled with disorganized road networks and dense construction in vulnerable zones, restricts the natural flow of rainwater into rivers, khals (canals), lakes, or designated retention areas. Consequently, rainwater often stagnates in these low-lying neighborhoods, exacerbated by rising river and canal water levels (Figure 4). The lack of coordinated urban planning, limited road coverage, and Dhaka’s topographical vulnerabilities collectively make the city highly sensitive to flood impacts. The street network not only fails to cope with the existing drainage demand but also contributes to the increasing intensity and frequency of urban flooding.
Methodology
Analyzing street networks during flooding can offer more precise insights than conventional assessment methods (Capaccio & Ellis, 2005). This research employs a methodological approach centered on Spatial Design Network Analysis (sDNA) to investigate and visualize the impact of flooding on the street network of Dhaka before and after flood events. By overlaying these two scenarios, the study identifies changes in network performance and flow disruptions caused by flooding. Geographic Information System (GIS) tools, combined with sDNA, enable spatial visualization and quantitative analysis of how flooding affects road accessibility, connectivity, and centrality. This helps assess the functional resilience of the urban transport network under stress.
sDNA Analysis
sDNA is a spatial network analysis tool integrated with platforms like ArcGIS, AutoCAD, and QGIS via Python APIs. It is used to evaluate spatial configurations of urban networks by converting road layouts into network links for detailed analysis. Metrics such as mean distance, closeness centrality, and betweenness centrality are calculated within a defined radial distance or “band.” Closeness centrality measures accessibility, typically defined as the inverse of the average distance from a given node to all others within a localized radius. It identifies how easily a location can be reached from elsewhere in the network (Cooper & Chiaradia, 2015). Betweenness centrality assesses the importance of a link or node based on how often it falls on the shortest path between other nodes. This metric reflects the potential volume of movement or flow through a segment (Cooper & Chiaradia, 2020). These indicators help quantify the network’s efficiency and identify which road segments are most critical and most vulnerable during flood scenarios.
Conceptual Framework
The conceptual framework (Figure 5) outlines the analytical process for examining flood resilience and adaptation strategies. It focuses on evaluating the direct and indirect impacts of flooding on the street network, and on proposing spatial strategies that align with long-term adaptation goals. The framework bridges data analysis with urban planning by linking flood vulnerabilities to street-level performance.
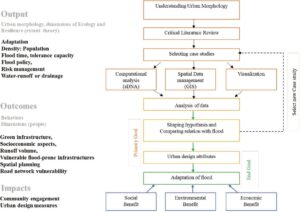
Figure 5 Conceptual Framework
Data Collection Strategy
Survey Sample
Specific areas within Dhaka were randomly selected based on topographic variation and known flood-prone characteristics. GIS datasets—sourced primarily from the Asian Development Bank (ADB) and World Bank—provided flood extent and elevation data. Although these datasets lack temporal detail (i.e., exact month or duration of flooding), they offer annual snapshots of flood-affected areas useful for spatial comparison.
Analytical Approach
The analytical process begins with an urban morphological assessment, combining land use distribution and flood-prone zone mapping through GIS. Mapping catchment areas and flood levels allows for a deeper understanding of localized vulnerabilities. The results inform how urban design interventions can promote a “living with water” approach and identify both opportunities and constraints in flood adaptation strategies.
Results and Discussion
Flood Scenarios
To analyze the flood patterns in Dhaka, GIS data from the Asian Development Bank (ADB) and World Bank was used. Figure 7 illustrates the spatial extent of flooding in the years 2004 (a), 2007 (b), and 2014 (c). However, the data lacks information on flood duration and specific timelines, and it does not distinguish between pluvial (rain-induced) and fluvial (river-induced) flooding. Instead, it provides a cumulative overview of areas affected by floodwaters. The maps reveal that most flood-prone zones are located in low-lying and recently urbanized areas. The severity of flooding in 2004 and 2014 was particularly high, mainly due to intense rainfall and runoff from Himalayan rivers. In contrast, 2007 experienced significantly less flooding and was marked as one of Dhaka’s driest years in recent history. Although recent GIS data could not be accessed, photographic evidence from 2022 (Figure 8) indicates that flood-prone areas remain consistently vulnerable year after year.
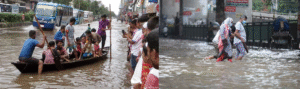
Figure 8 Current scenario of flood in Dhaka city, 2022, source: https://www.aa.com.tr, 2022
Network Model
To assess the impact of flooding on Dhaka’s street network, a macro-scale analysis was performed using Spatial Design Network Analysis (sDNA).
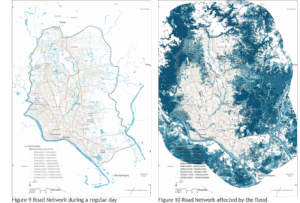
Figures 9 and 10 illustrate the road network during normal conditions and under flooding stress, respectively.
In Figure 9, red-colored links signify highly connected roads that serve as the city’s primary traffic arteries. These segments exhibit high betweenness centrality and are critical for overall network flow. Disruption of these routes can lead to major traffic congestion and severely impact daily commuting. Orange and yellow links represent moderately connected roads that primarily serve local areas. Blue links indicate minor roads with low flow potential, often found within blocks or cul-de-sacs, and are less critical in the overall circulation but essential for neighborhood-level connectivity. Figure 10 overlays historical flooding data (from 2004, 2006, 2014, and 2016) on the road network. Darker shades of blue highlight areas that experienced frequent flooding during these years. Analysis indicates that while some major road links were affected, most of the severe disruption occurred in low-lying zones, especially at the meso-scale. Some blocks were completely inundated, while others were partially affected. Due to incomplete pluvial/fluvial classification, the central regions of Dhaka show minimal recorded impact, though this may not reflect the real situation.
Figure 11 zooms into three strategically chosen zones to illustrate flooding impacts at the meso- and micro-scales. Several key roads were analyzed in their post-flood conditions using sDNA and GIS tools. The disruption of major roads forced vehicular traffic to reroute through smaller, narrower streets not designed for heavy capacity. This shift increased congestion and raised the risk of local infrastructure failure. Based on these findings, it becomes evident that understanding street-level vulnerabilities is essential for building flood-resilient urban infrastructure. These insights can inform future policy and design interventions aimed at improving alternative connectivity, managing traffic loads, and strengthening emergency response routes during flooding events.
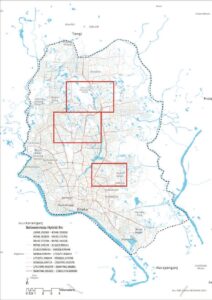
Figure 11 Impact of flood over the street network of Dhaka
Flood Exposure: Impact on Street Network
Meso-scale street network analysis, illustrated in Figures 12, 13, and 14, highlights the significant impact of flooding on the connectivity and functionality of Dhaka’s road system. To assess the level of disruption, comparisons were made between the street network before flooding (shown in Figure (a)) and after flooding (Figure (b)). The sDNA analysis in Figure 12 reveals that traffic flow increases substantially in areas surrounding flooded zones. Specifically, disruption of a major east-west road forces traffic onto narrower local roads, which serve as the best available alternative routes despite their limited capacity. For instance, one critical alternative road carrying the highest traffic flow after flooding, marked in red in Figure 12(b), is only 3.5 meters wide. This results in a 68% increase in travel distance. Additionally, several local roads that originally handled low traffic volumes (yellow) experience an increase to moderate or high flows (orange to red), indicating heightened congestion risks. Similarly, Figure 13 depicts a flood-induced interruption on a major north-south route connecting different parts of Dhaka. Post-flooding, local and tertiary roads become primary connectors, shifting from low-flow to high-flow status. Unfortunately, some alternative paths are impractical; one route crosses a restricted area belonging to the Bangladesh Air Force, while another narrow 3-meter-wide road struggles to support increased traffic. These detours cause travel distances to grow by as much as 250%, exacerbating transport inefficiency.
![]()
![]()
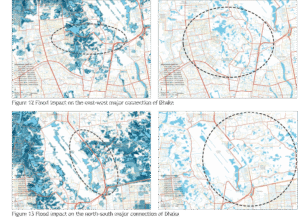
In Figure 14, the residential area between Khilgaon and Banasree demonstrates how local roads suffer from flooding-related disruptions. The shortest and most angular routes are forced to divert traffic onto already crowded main roads, intensifying congestion. This situation severely hampers mobility for residents, with travel distances sometimes increasing by up to 300%. Many of the alternative routes in this area remain narrow, around 3 meters wide, failing to accommodate the surge in traffic volume adequately.
Table 1 further supports these observations by showing that Betweenness to Heterogeneous Node (BtHn) values remain relatively stable at the meso-scale (R=400), implying pedestrian connectivity is mostly unaffected during floods. However, at the macro-scale (R=n), these values fluctuate significantly, reflecting how larger city-wide road networks suffer more pronounced disruptions. Thus, while community-level pedestrian movement remains fairly consistent, the vehicular street network across the city faces considerable challenges in maintaining connectivity without viable alternatives.

Table 1 Changes in BtHn values in before and after situation of flooding in selected roads
Proposed Strategies
Based on the results and analysis, a combination of short-term and long-term strategies is essential to effectively reduce the impacts of flooding on Dhaka’s Street network. In the short term, urgent and practical measures should focus on maintaining continuity and functionality of the network during flood events. This involves widening some existing roads that serve as critical alternative routes during floods to better accommodate increased traffic loads. Additionally, retrofitting these roads with efficient water discharge systems can improve their resilience by preventing water accumulation and facilitating faster drainage. Surface-level interventions are also crucial; the use of permeable pavements and breathable construction materials can significantly reduce waterlogging on road surfaces, allowing vehicles and pedestrians to move more easily even during moderate flooding. These quick interventions can help to manage immediate disruptions and minimize congestion and accessibility issues in flood-affected areas. In the long term, the focus must shift towards developing more sustainable and permanent solutions to enhance the city’s overall flood resilience. Upgrading and expanding the drainage infrastructure is a key priority, particularly by constructing underground drainage networks capable of handling larger volumes of stormwater. This improvement will help reduce surface flooding and improve the city’s ability to cope with heavy rainfall and river overflows. Moreover, integrating innovative technologies can transform the way the city adapts to future flood challenges. Solutions such as floating roads can provide reliable transport routes even during high water levels, while bioretention ponds and engineered rainwater gardens can manage stormwater naturally and improve urban green spaces. Automated water discharge pumps will help in the timely removal of excess water, and advanced traffic warning systems can inform commuters about flood-affected areas to prevent congestion and accidents. By combining these strategies, Dhaka can develop a flood-resilient urban environment that supports sustained mobility and connectivity, even during extreme weather events, ultimately improving the quality of life for its residents.
Conclusion
This research demonstrates how integrating flooding data with network analysis can effectively examine the impact of floods on urban mobility. The proposed methodology highlights the adverse relationship between flooding and the functionality of the street network, clearly illustrating the direct consequences floods have on city connectivity. Through detailed data analysis and visual representation, the study reveals not only the extent of disruption caused by flooding but also identifies possible alternative routes and solutions to mitigate its effects. This approach offers valuable insights for government agencies and city planners in flood-prone areas to enhance and tailor flood mitigation policies more effectively. Despite these contributions, the research acknowledges certain limitations, primarily related to data availability and currency. Access to recent GIS data and more advanced spatial network analyses would enable a more precise assessment of flood impacts and improve the practical implementation of proposed strategies. Factors such as road typology, vehicle flow patterns, and road width can influence how flooding affects transportation networks, and these variables require further investigation. A comparative analysis between flooded and non-flooded conditions across different street network types could provide stronger evidence of the effectiveness of spatial network analysis in developing flood-resilient urban environments. Additionally, incorporating related data such as land use patterns, pedestrian connectivity, and traffic flow rates would offer a broader and deeper understanding of flooding impacts on cities. Ultimately, this study contributes a comprehensive strategic tool that supports existing and future planning policies. It equips relevant authorities with a forward-looking framework to design adaptive, flood-resilient urban development plans that safeguard mobility, connectivity, and overall city functionality during extreme weather events.
Acknowledgements
The authors would like to thank the Asian Development Bank and the World Bank for providing access to the GIS datasets used in this study. We also appreciate the support and guidance from colleagues and reviewers who contributed valuable insights to improve this research.
Declaration of Interest
The authors declare that they have no known competing financial interests or personal relationships that could have appeared to influence the work reported in this paper.
Funding Statement
This research did not receive any specific grant from funding agencies in the public, commercial, or not-for-profit sectors. (Alternatively, specify any funding details if applicable.)
Data Availability
The GIS data used in this study are publicly available from the Asian Development Bank (ADB) and World Bank databases. Additional processed data supporting the findings of this study are available from the corresponding author upon reasonable request.
References
Capaccio, A., & Ellis, J. (2005). Street network analysis methods for flood impact assessment. [Details needed—Journal/Conference].
Cooper, C. H. v., & Chiaradia, A. (2020). Spatial Design Network Analysis: 3D spatial network analysis with ArcGIS, AutoCAD, and QGIS. [Details needed—Publisher or Journal].
Cooper, C., & Chiaradia, A. (2015). Closeness centrality and accessibility in spatial networks. Urban Analytics Journal, [Volume(Issue)], pages. [Details needed].
Asian Development Bank (ADB). (n.d.). GIS data on flood-affected areas of Dhaka city. Retrieved from [Database URL if available].
World Bank. (n.d.). GIS data on flooding in Dhaka. Retrieved from [Database URL if available].
AA News Agency. (2022). Current flood scenario of Dhaka city. Retrieved from https://www.aa.com.tr