Arifa Nadeem¹, Zara Waqas¹, Faisal Jamil ²,
¹School of Business and Economics, Quaid-i–Azam University, Islamabad, Pakistan
² Department of Finance and Banking, National University of Management Sciences, Lahore, Pakistan
* Corresponding Author: Arifa Nadeem Email: [email protected]
Abstract
The pursuit of sustainable development has gained significant global attention, with the United Nations Sustainable Development Goals (SDGs) providing a structured framework to guide policy and progress. Environmental deterioration—marked by surging greenhouse gas emissions, deforestation, industrial pollutants, fossil fuel depletion, and biodiversity loss—continues to threaten planetary health. This study investigates the role of financial inclusion in fostering environmental sustainability in the context of the Next-11 (N-11) economies between 1995 and 2019. A comprehensive financial inclusion index was constructed using principal component analysis (PCA), incorporating three demand-side and three supply-side indicators. To assess the long-term dynamics, a combination of first-generation and second-generation econometric techniques was employed. The Westerlund co-integration test confirmed robust long-run associations among the variables. Using Dynamic Common Correlated Effects (DCCE) and the Generalized Method of Moments (GMM), the findings reveal that financial inclusion significantly contributes to reducing ecological degradation, aligning with SDG targets. Conversely, economic expansion and financial development appear to exacerbate the ecological footprint, suggesting that unsustainable credit expansion—rather than inclusive finance—is the primary concern. Policymakers in the N-11 countries are advised to direct financial flows toward green and sustainable initiatives, and to continue broadening access to financial services in order to mitigate environmental decline. These insights offer valuable guidance for integrating financial policies with sustainability objectives in emerging market contexts.
Keywords:
Ecological footprint, financial inclusion, sustainable development goals, dynamic common correlated effects, Next-11 economies, generalized method of moments
© The Author(s) 2025. Open Access This article is licensed under a Creative Commons Attribution-NonCommercial–NoDerivatives 4.0 International License, which permits any non-commercial use, sharing, distribution and reproduction in any medium or format, as long as you give appropriate credit to the original author(s) and the source, provide a link to the Creative Commons licence, and indicate if you modified the licensed material. You do not have permission under this licence to share adapted material derived from this article or parts of it. The images or other third-party material in this article are included in the article’s Creative Commons licence, unless indicated otherwise in a credit line to the material. If material is not included in the article’s Creative Commons licence and your intended use is not permitted by statutory regulation or exceeds the permitted use, you will need to obtain permission directly from the copyright holder. To view a copy of this licence, visit https://creativecommons.org/licenses/by-nc-nd/4.0/
1. INTRODUCTION
Sustainable development necessitates ecological preservation while progressing along the path of economic growth. However, the trajectory of human activities has inflicted significant environmental damage, manifesting in pollution, climate change, and increased ecological footprints (Annamalaisamy & Vepur Jayaraman, 2023). In light of escalating global climate shifts, ecological scarcity has become increasingly prevalent, with over 85% of the global population impacted by ecological overshoot (Global Footprint Network, 2020). In response, scholars and policymakers have sought to identify both the contributors to and victims of accelerating environmental degradation (Le et al., 2020). Environmental security, in conjunction with socioeconomic stability, lies at the heart of the United Nations’ Sustainable Development Goals (SDGs). Specifically, Goals 7, 11, 13, 14, and 15 are centered around environmental governance (Adebayo et al., 2022; Zeraibi et al., 2021). While financial inclusion is not explicitly mentioned in the 2030 Agenda, it is recognized as a foundational tool for realizing the SDGs, being relevant to eight of the 17 objectives (Zaidi et al., 2021). Financial inclusion contributes to reducing income inequality, poverty, and gender disparities, thereby fostering economic growth (Ali et al., 2021; Aracil et al., 2022). Furthermore, access to affordable financing for low-income groups supports productive activities, enhancing employment and output, particularly in rural areas (Kara et al., 2021). Such microeconomic benefits aggregate into national economic gains (Anarfo et al., 2019), elevating living standards through increased household income.
Additionally, broader access to banking services, insurance, and capital markets boosts liquidity in financial systems, enabling more efficient capital allocation toward long-term investments that drive economic expansion and support SDG implementation (Anarfo et al., 2019; Kuada, 2019). Thus, financial inclusion serves as a complementary strategy in the pursuit of sustainable development (Valencia et al., 2021).
The concept of financial inclusion gained prominence through Chibba’s (2009) seminal work, which identified financial exclusion as a root cause of poverty. According to the Financial Inclusion Overview (2018), financial inclusion encompasses the availability and responsible use of a broad spectrum of financial services and products—such as payments, savings, credit, and insurance—by individuals and businesses. It is considered a crucial element of economic development, playing a pivotal role in constructing the financial infrastructure required for social and economic progress (Anarfo et al., 2019; Van et al., 2021). While its impact on economic growth is well-documented, financial inclusion also carries potential implications for the environment.
The environmental dimension of inclusive finance has garnered increasing scholarly attention in recent years (Ali et al., 2022). However, literature presents a divided perspective regarding the nexus between financial inclusion and ecological sustainability (Chaudhry et al., 2022). On one hand, inclusive financial systems catalyze economic activity and demand a range of resources, enabling business development and capital accumulation (Rehman et al., 2022). Financial systems also enhance foreign capital inflows and stimulate consumption behaviors. Moreover, greater financial access can encourage the purchase of energy-intensive goods—such as home appliances, air conditioning systems, and automobiles—as well as upscale housing and infrastructure (Qin et al., 2021). These consumption patterns typically rely on conventional energy sources, leading to increased industrial waste, fossil fuel depletion, pollution, and overall ecological degradation (Hussain et al., 2021). On the other hand, financial inclusion and development can facilitate investments in clean technologies and support the deployment of renewable energy, thereby improving energy efficiency and reducing environmental harm (Chaudhry et al., 2022; Qin et al., 2021). Given these contrasting outcomes, empirical evidence remains inconclusive regarding the environmental consequences of financial inclusion.
Moreover, limited research explores the intersection of financial inclusion and environmental degradation, particularly in the context of policy frameworks. The absence of policy coordination between financial inclusion initiatives and environmental goals raises critical questions about the role financial access can play in sustainable development strategies at various governance levels (Le et al., 2020). As such, it is imperative to investigate whether expanding financial inclusion contributes positively to ecological sustainability.
This study is grounded in the Environmental Kuznets Curve (EKC) hypothesis, which posits a non-linear relationship between economic growth and environmental quality. According to this theory, environmental degradation worsens in the early phases of economic development but improves as income reaches a certain threshold (Grossman & Krueger, 1995). Nonetheless, income alone cannot explain environmental trends, as other factors—such as financial inclusion, financial development, urbanization, trade liberalization, and institutional quality—also exert influence (Chaudhry et al., 2022). In this context, financial inclusion may initially degrade environmental quality; however, at advanced stages, it may drive investment in green technologies, thereby improving ecological conditions through reduced greenhouse gas emissions and smaller ecological footprints.
While a substantial body of research has explored the environmental effects of financial development, limited attention has been paid to the ecological implications of financial inclusion (Ahmad & Satrovic, 2023; Chaudhry et al., 2022; Zaidi et al., 2021). Although financial development and ecological sustainability have been widely examined (Usman et al., 2023), the emerging debate around financial inclusion’s role remains underexplored (Zeraibi et al., 2023). Since Le et al.’s (2020) initial contribution, only a few studies have examined the effect of financial inclusion on environmental indicators. For instance, Chaudhry et al. (2022) found that financial inclusion reduces ecological footprints in Organization of Islamic Cooperation (OIC) countries, while Hussain et al. (2021) reported the opposite effect in OECD nations. Similarly, Qin et al. (2021) concluded that financial inclusion curtails carbon emissions in the E7 economies, whereas Zaidi et al. (2021) suggested it exacerbates them. Fareed et al. (2022) observed that inclusive finance intensifies environmental issues in European countries, while Shahbaz et al. (2022) found that it enhances environmental quality in China by lowering pollutant emissions. These mixed findings highlight that few studies have directly incorporated financial inclusion into environmental quality models, and their outcomes remain inconclusive (Fareed et al., 2022).
Against this backdrop, the present study aims to investigate the impact of financial inclusion on ecological sustainability in the context of the Next-11 economies. It also considers financial development, energy consumption, economic growth, urbanization, and trade openness as key control variables influencing ecological footprints. This research thus seeks to address two pivotal questions: (1) Does financial inclusion affect ecological sustainability in Next-11 countries? and (2) Do financial development, energy consumption, economic expansion, urbanization, and trade openness significantly influence ecological sustainability in these nations?
According to Goldman Sachs, the Next-11 (N-11) refers to a group of 11 emerging economies—Bangladesh, Egypt, Indonesia, Iran, Mexico, Nigeria, Pakistan, Philippines, Turkey, South Korea, and Vietnam—that are projected to surpass the BRIC countries in economic influence during the 21st century (O’Neill et al., 2005). These countries possess significant potential for future growth and offer promising investment opportunities. The classification of the Next-11 was based on key indicators such as macroeconomic stability, political maturity, openness to trade and investment, and a strong focus on education. It is projected that by 2050, the combined GDP of the N-11 countries could reach nearly two-thirds of the G-7 economies (O’Neill et al., 2005; Yilanci & Kilci, 2021). These countries have been selected for this study due to their increasing ecological imbalance, making it essential to examine environmental deficits in nations that significantly contribute to global economic growth (Wang, You, et al., 2022). The N-11 nations are intensifying their economic development efforts, primarily through increased energy consumption. In 2007, these countries accounted for 9% of the world’s energy use, 30% of carbon dioxide emissions, and 7% of global GDP. Consequently, the pursuit of economic advancement in these regions is closely associated with escalating energy demands, which, in turn, leads to environmental degradation (Raza et al., 2020). Despite economic progress, the environmental conditions in these countries have worsened over time (Murshed et al., 2022). Figure 1 illustrates the primary energy consumption levels across the N-11 countries, with South Korea having the highest share, followed by Iran, and Bangladesh showing the lowest consumption. Figure 2 depicts the ecological deficits in these countries, highlighting Mexico as having the highest ecological footprint (EFP) and Turkey the lowest. The growing trend in EFP values across these nations underscores the urgent need for strategic policy interventions aimed at ensuring environmental sustainability for future generations.
This study contributes to the existing body of literature in several significant ways. First, although limited research exists on the impact of financial inclusion on environmental quality, to the best of our knowledge, no prior study has examined the relationship between financial inclusion and environmental degradation—as measured by EFP—within the N-11 context.
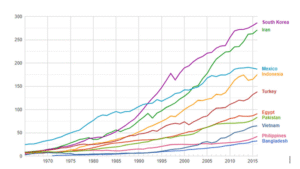
Figure 1. Total Primary Energy Consumption (in Mtoe) Among Next-11 Nations. Source: Energy Education.
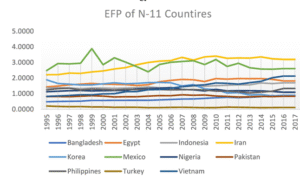
Figure 2. Ecological Footprint Across Next-11 Economies. Source: Compiled by the Authors.
The EFP provides a more holistic assessment of environmental impact, encompassing various dimensions of resource consumption, including grazing land for livestock, cropland for agriculture, forest areas for timber, built-up land for housing, fisheries for marine food, and the carbon footprint arising from fossil fuel combustion and greenhouse gas emissions. Hence, EFP offers a more comprehensive metric of environmental quality than CO₂ emissions alone, which prior studies have predominantly relied upon. Second, the study also incorporates financial development alongside financial inclusion as a control variable to discern whether environmental degradation is driven by broader financial sector growth or specific aspects of financial inclusivity. The results indicate that credit expansion may heighten vulnerability to climate change. Third, in addition to financial variables, the study includes several critical factors such as energy consumption, urbanization, trade openness, and economic growth. Fourth, unlike previous studies that used traditional first-generation econometric techniques prone to methodological issues like cross-sectional dependence, heterogeneity, and heteroscedasticity, this study employs the more robust “Dynamic Common Correlated Effects (DCCE)” approach to address such limitations. Fifth, earlier literature predominantly relied on CO₂ emissions as the sole indicator of environmental deterioration, which could be an inadequate representation. This research, instead, uses EFP to yield more reliable insights into environmental quality (Ali et al., 2021; Uzar, 2021). Sixth, while prior studies have used varied proxies to measure financial inclusion, this study adopts principal component analysis (PCA) to construct a composite financial inclusion index derived from six indicators, encompassing both demand-side and supply-side dimensions. Finally, rising pollution levels in N-11 countries have attracted increasing attention from governments, academics, and policymakers. Accordingly, this study offers valuable recommendations on how enhancing financial inclusion can support both the achievement of Sustainable Development Goals (SDGs) and the promotion of environmental security.
The remainder of this research is organized as follows: the literature review section critically examines previous empirical studies on the central issue, followed by a discussion of the findings. The data and methodology section outlines the study sample, time frame, data sources, and applied econometric methods. The study concludes with key policy recommendations and limitations.
2 LITERATURE REVIEW
2.1 | Financial Inclusion and Ecological Sustainability
Access to efficient and inclusive financial services may directly contribute to achieving several United Nations Sustainable Development Goals (SDGs), such as poverty alleviation, improved health and education, and enhanced social equity (Kara et al., 2021). However, the environmental consequences of financial inclusion (FI) cannot be overlooked. Despite the growing academic interest in exploring the environmental implications of FI, empirical studies on the topic remain limited and yield inconclusive results. One perspective suggests a detrimental or exacerbating effect of FI on environmental quality. For instance, Le et al. (2020) examined the impact of FI on environmental outcomes across Asian nations between 2004 and 2014. Their findings indicated that financial inclusion, urbanization, and foreign direct investment (FDI) contributed to increased CO₂ emissions, whereas trade openness appeared to mitigate environmental degradation. Similarly, Liu, Sinha, et al. (2022) identified a positive association between FI, economic expansion, and carbon emissions in emerging Asian economies. Hussain et al. (2021) also found that FI, along with corruption and energy consumption, intensifies the ecological footprint in sampled countries. Correspondingly, Mehmood (2021) concluded that financial inclusion aggravates carbon emissions, advocating for the integration of environmental objectives into FI-related policies.
Conversely, a second body of literature argues that FI fosters environmental sustainability by supporting the development of green technologies, encouraging investment in renewable energy, and facilitating the adoption of less energy-intensive production methods. Chaudhry et al. (2022) reported that while FI correlates positively with carbon and methane emissions, as well as deforestation, it exhibits a negative association with the ecological footprint and nitrous oxide emissions across Organisation of Islamic Cooperation (OIC) countries—supporting the Environmental Kuznets Curve (EKC) hypothesis. Shahbaz et al. (2022) similarly demonstrated that FI improves environmental outcomes in China by reducing carbon emissions. Their study found that while FI’s direct impact on emissions is context-specific, its indirect effect through altered energy consumption patterns contributes to environmental improvement. Qin et al. (2021) showed that FI helps limit carbon emissions at the 25th and 50th quantiles, though its explanatory power diminishes at the extremes (7th and 95th quantiles), and they affirmed the EKC hypothesis for seven emerging economies. Rehman et al. (2022) highlighted that the ecological impact of FI varies across quantiles and is moderated by governance quality, which plays a critical role in reducing the ecological burden associated with financial inclusion. Fareed et al. (2022) explored innovation as a moderating factor and found that although FI generally contributes to environmental degradation, innovation activities mitigate this adverse effect. Pradhan et al. (2021) investigated the dynamic relationship among FI, economic growth, and ICT development across 20 Indian states, revealing that all three components are vital for sustainable development. In a related study, Pradhan and Sahoo (2021) established temporal causality among FI, economic growth, and mobile telephony within Indian states.
In sum, the literature exploring the nexus between financial inclusion, economic growth, and environmental quality presents mixed findings. Notably, there exists a research gap concerning the specific case of the Next-11 economies—nations actively liberalizing their markets and advancing financial inclusion. Therefore, this study seeks to address this gap by examining how financial inclusion impacts environmental vulnerability in these economies and by assessing the environmental alignment of FI policies in the context of achieving the SDGs, which forms the central focus of this research.
2.2 | Theoretical Framework and Model Development
Macroeconomic models addressing ecological sustainability are frequently grounded in the Environmental Kuznets Curve (EKC) hypothesis and incorporate additional control variables to reflect complex environmental dynamics. The EKC hypothesis posits a nonlinear relationship between economic growth and environmental degradation (Dinda, 2004; Grossman & Krueger, 1995). In the early stages of development, characterized by low national and per capita income levels, investments typically prioritize income-generating activities, which lead to industrial expansion, natural resource depletion, and increased energy use. Over time, as income levels rise, societies become more environmentally conscious and invest in green technologies and renewable energy solutions, thereby reducing ecological harm. This inverted U-shaped relationship between income and environmental degradation constitutes the core of the EKC framework. The hypothesis holds only when economic growth first leads to environmental decline but is followed by improvement after surpassing a certain income threshold (Chaudhry et al., 2022).
Nonetheless, attributing environmental degradation solely to economic growth presents an overly simplistic view. As such, contemporary studies have expanded the EKC framework by incorporating additional variables that may affect both the shape and trajectory of the EKC (Chaudhry et al., 2022; Qin et al., 2021). In line with this theoretical progression, the present study augments the traditional EKC model by integrating financial inclusion, while controlling for financial development, urbanization, energy consumption, and trade openness.
As previously discussed, the influence of financial inclusion on the ecological footprint (EFP) is ambiguous, reflecting its dual role in either aggravating or mitigating environmental degradation. Therefore, increasing levels of FI may alter the curvature of the EKC by intensifying the trade-off between economic growth and environmental quality or by alleviating it. If FI contributes to a rise in the EFP, the EKC may steepen, indicating a stronger negative environmental impact at lower levels of economic growth. Alternatively, if FI reduces the EFP, the EKC may flatten, signifying a diminished environmental cost of growth. Given that FI is generally associated with enhanced economic growth, it is plausible to hypothesize that higher levels of FI could accelerate the achievement of income thresholds beyond which environmental improvements become viable (Qin et al., 2021). In support of this argument, Xie, et al. (2022) found that FI significantly contributes to carbon emissions in Sub-Saharan Africa, as demonstrated through CS-ARDL techniques. Similarly, Destek, Oğuz, and Okumuş (2023) examined the environmental consequences of trade and financial activities, concluding that while trade globalization showed no notable effect, economic growth consistently exacerbated carbon emissions.
Financial inclusion (FI) is widely recognized as a crucial element of financial development (FD). Accordingly, this study integrates FD into the augmented Environmental Kuznets Curve (EKC) framework. A nation’s economic expansion is fundamentally linked to the robustness of its financial sector, as it facilitates the circulation of capital necessary to drive the production and service sectors. Notably, financial sector development significantly influences environmental conditions. A substantial body of literature explores the relationship between FD and environmental quality, though findings remain inconclusive. Several studies emphasize the positive influence of FD on environmental outcomes. For instance, Khan et al. (2021) observed a favorable impact of FD on the ecological footprint (EFP) in Malaysia, while Usman and Balsalobre-Lorente (2022) reported similar findings for newly industrialized economies. Likewise, Mehmood (2022) found supporting evidence for G-11 countries. Conversely, Huang et al. (2022) reported no significant association between FD and the EFP in E-7 and G-7 countries.
In contrast, other research highlights FD’s potential to enhance environmental quality by advancing clean energy initiatives and supporting green technologies through innovation and R&D (Guo et al., 2019). Furthermore, FD facilitates access to green financing mechanisms, directing capital toward environmentally sustainable ventures (Khan et al., 2019; Sherif et al., 2022). Empirical studies by Akinsola et al. (2022) and Gokmenoglu et al. (2021) also reinforce this view. Overall, the literature presents mixed conclusions regarding whether FD improves or undermines environmental quality, particularly given the limited integration of FD and FI within a single augmented EKC model. Therefore, it is posited that in developing economies, increased credit accessibility may shape consumption patterns that contribute to heightened EFP levels.
Regarding economic growth, similar to FI, FD may both intensify and moderate the curvature of the EKC, contingent on the level of development and financial depth. In the long run, enhanced FD could prove beneficial for the environment by lowering the economic growth threshold and flattening the EKC curve.
Beyond financial elements, energy consumption is integral to economic advancement and is often referred to as the backbone of economic development (Mahjabeen et al., 2020). However, it is simultaneously identified as a primary contributor to greenhouse gas emissions and environmental degradation (Ouyang et al., 2019; Qin et al., 2021). Numerous studies have indicated that a strong dependence on fossil fuel-based energy is environmentally detrimental. Persistent combustion in power plants, machinery, and vehicles has amplified anthropogenic greenhouse gas emissions (Miao et al., 2022). Consequently, this study hypothesizes that a high share of fossil fuel consumption in the energy mix results in inevitable environmental degradation, which in turn hinders economic growth, raises the threshold level of economic development, and exacerbates the curvature of the EKC.
Economic globalization and trade have fostered mutually advantageous ties between developed and developing nations. However, this dynamic often results in the relocation of pollution-intensive industries to developing countries under the guise of trade, investment, and cooperation (Wang et al., 2023). The existing literature presents conflicting and bidirectional outcomes regarding the impact of trade openness (TO) on EFP, largely influenced by a nation’s industrial and economic maturity. Some researchers report a positive influence of TO on environmental quality (Nathaniel & Khan, 2020; Wang, Rehman, & Fahad, 2022), whereas others highlight its adverse effects (Destek & Sinha, 2020; Park et al., 2018). Meanwhile, studies such as Nassani et al. (2020) have found TO to have an insignificant impact. This study anticipates a positive relationship between TO and EFP in developing countries, given the pollution-intensive nature of their industrial sectors and the prioritization of economic output over environmental considerations.
Urbanization contributes essential labor for economic development but also significantly diminishes the Earth’s regenerative capacity and contributes to greenhouse gas emissions, accounting for approximately 70% of global energy-related CO₂ emissions (Nathaniel & Khan, 2020). Research on urbanization’s environmental impact is mixed. Several studies highlight urbanization as a major contributor to environmental deterioration (Ahmed et al., 2020; Anwar et al., 2021; Wang et al., 2023), while others report negligible effects (Nathaniel & Khan, 2020) or even negative associations (Nathaniel et al., 2019). Destek, Sinha, et al. (2023) argue that emerging economies face obstacles in achieving sustainable development goals, particularly due to the environmental impact of both domestic and foreign capital flows. Their findings indicate that while domestic capital degrades the environment, foreign capital contributes positively to environmental sustainability. Similarly, Zeng et al. (2023) suggest that initial phases of growth escalate carbon emissions, with foreign trade and technology further exacerbating environmental degradation. Therefore, this study postulates that although urbanization supports economic development by supplying key input factors, it also accelerates the depletion of natural resources and the onset of environmental challenges—especially in developing countries where there is limited environmental awareness, excessive resource consumption, and unregulated urban sprawl.
3. METHODOLOGY AND DATA
This study explores the nexus between finance, economic growth, and environmental quality in the Next-11 countries over the period 1995–2019. The Next-11 group comprises Bangladesh, Egypt, Indonesia, Iran, Korea, Mexico, Pakistan, the Philippines, Turkey, and Vietnam. The analysis employs an unbalanced panel due to the availability of financial inclusion data beginning only in 2004. To ensure consistent and robust empirical outcomes, all variables, except the index, are transformed into logarithmic form. This transformation facilitates the application of log-linear models, which mitigate sharp fluctuations in time series data and improve model performance after controlling for variance (Mrabet & Alsamara, 2017). Financial inclusiveness in this context is defined as the access to and usage of formal financial services to promote capital stability (Van et al., 2021). The financial inclusion index is constructed using principal component analysis (PCA), as guided by the methodology of Anarfo et al. (2019), incorporating six indicators—three representing supply-side dimensions and three reflecting demand-side aspects of financial inclusion.
PCA, originally developed by Karl Pearson in 1901, reduces the dimensionality of large datasets by transforming them into a smaller set of uncorrelated variables known as principal components. This method employs orthogonal transformation to extract components that explain the maximum variance in the original dataset. The principal component is identified based on its eigenvalue, with components having eigenvalues greater than one deemed significant. When multiple components exceed this threshold, the one with the highest eigenvalue is selected. The general mathematical expression for constructing the index is:
n
Index = Σ (Wi * Xit)
i=1
In this equation, the index is derived by multiplying the weight (Wi) by the individual factor scores (Xit), where the weight represents the proportion of variance explained by each indicator relative to the total variance. The specific formula used to compute the financial inclusion index is as follows:
FI = WJ1X1 + WJ2X2 + WJ3X3 + WJ4X4 + WJ5X5 + WJ6X6 (1)
Here, FI represents the financial inclusion index; W(J1…6) denotes the weights assigned to each of the six factors, and X(1…6) indicates the original values of the corresponding components. The six indicators include the number of automated teller machines per 100,000 adults (ATMHTA), bank branches per 100,000 adults (BRHTA), commercial bank branches (CBB), number of bank accounts (BATA), number of borrowers from commercial banks (BFCB), and number of depositors with commercial banks (DCBTA). A detailed description of these variables is presented in Table 1. All other variables in the model are log-transformed, as the log-linear specification reduces volatility in the time series data and enhances estimation quality.
Incorporating these parameters, the final log-linear econometric model is specified as:
LNEFPit = α + β1FIit + β2LNFDit + β3LNECit + β4LNTOit + β5LNURBit + β6LNGDPit + β7LNGDP2it + έit (2)
Table. 1 Measurement units and details of variables.
|
Abbreviation |
Variable Name |
Measurement Unit |
Data Source |
|
LNEFP |
Ecological Footprint |
Global hectares (GHA) per capita |
Global Footprint Network |
|
LNY |
Economic Growth |
Gross Domestic Product (GDP) per capita |
World Bank |
|
FI |
Financial Inclusion |
Composite index based on six indicators: ATMs per 100,000 adults, bank branches per 100,000 adults, commercial bank branches per 100,000 adults, bank accounts per 1,000 adults, borrowers from commercial banks per 1,000 adults, and depositors with commercial banks per 1,000 adults |
IMF Financial Survey, World Bank |
|
LNFD |
Financial Development |
Domestic credit provided by the banking sector as a percentage of GDP |
World Bank |
|
LNEC |
Energy Consumption |
Total energy consumption (in logarithmic form) |
World Bank |
|
LNURB |
Urbanization |
Urban population as a percentage of the total population |
World Bank |
|
LNTO |
Trade Openness |
Ratio of total trade (exports + imports) to GDP |
World Bank |
Where LNEFP denotes the natural logarithm of the ecological footprint, FI signifies financial inclusion, LNFD represents the natural logarithm of financial development, LNEC corresponds to the natural logarithm of energy consumption, LNTO indicates the natural logarithm of trade openness, LNURB stands for the natural logarithm of urbanization, and LNGDP refers to gross domestic product per capita. The term έit denotes the error component, which is assumed to be normally distributed with zero mean and constant variance. The parameters of the model, or the long-run elasticities associated with the explanatory variables, are denoted by βi, where i ranges from 1 to 7.
3.1 Econometric Methodology
Prior to employing any other econometric techniques, the study tests for the presence of cross-sectional dependence (CSD) among the panel units. Addressing CSD is crucial because neglecting it can lead to biased results, incorrect test sizes, and misleading inferences regarding stationarity and cointegration (Zaidi et al., 2021). The Pesaran (2015) CSD test is utilized to detect cross-sectional dependence within the dataset. The test statistic is expressed as follows:
N(N — 1) I=i J=i+1
CD = sffiffiffiffiffiffiffi2ffiffiffiTffiffiffiffiffiffiffiffiffi NX—1 XN bij (3)
In the equation, EFP stands for ecological footprint, αiEFPit—1 for ecological footprint lag value, δit stands for independent variables, and PT stands for the number of lags.
3.1.1 Cross-sectional Dependent Panel Unit Root Test
Traditional unit root tests, such as those proposed by Levin et al. (2002) and Im et al. (2003), do not account for cross-sectional dependence or heterogeneity, relying instead on simplifying assumptions. Consequently, their application in the presence of CSD can produce unreliable outcomes. The Cross-sectionally Augmented IPS (CIPS) test developed by Pesaran (2007), a second-generation panel unit root test, effectively addresses both heterogeneity and cross-sectional dependence. The CIPS statistic is calculated as:
N
Cips(N, T) = N—1 ti (N, T) (4)
i=1
where ti(N,T) is the CADF test statistic for the ith cross-sectional unit.
3.1.2 Westerlund Cointegration Test
First-generation cointegration tests often disregard issues such as heteroscedasticity, cross-sectional dependence, and serial correlation, which can lead to erroneous conclusions. Westerlund and Edgerton (2008) introduced a cointegration test that accounts for these concerns and performs robustly even with small sample sizes. The test computes statistics based on panel means (Pt, Pa) and group means (Gt, Ga). While the panel mean statistics consider the error correction term across the entire panel, the group mean statistics regress the weighted mean of the error correction terms at the individual group level. Hence, the test statistics evaluate the presence of cointegration among variables through the error correction mechanism. The general form of the test equation is:
qi qi
Δyit = δ´dt + ai yi,t—1 — βι´xi, t—1 + X aijΔyi, t—1 + X γij Δxi, t—1 + ei,t (4)
j=—qi
j=—qi
where yit are the endogenous variables, i indexes cross-sectional units, t denotes time periods, and dtd_tdt represents deterministic components.
3.1.3 Dynamic Common Correlated Effects Estimation (DCCE)
Many prior panel studies have overlooked the presence of cross-sectional dependence and have assumed slope homogeneity across units. First-generation panel estimators typically allow only intercept heterogeneity, imposing homogeneity on slope coefficients, which may result in biased inferences. Given the rising importance of panel data with large time dimensions and heterogeneous coefficients across cross-sectional units, the Dynamic Common Correlated Effects (DCCE) estimator offers a robust alternative that addresses these concerns (Pesaran et al., 1999; Pesaran & Smith, 1995). The general specification of the DCCE model is
p=0
p=0
EFPit = αi EFPit—1 + δi Xit + X γxip Xt—p X γyipYt—p + μit (5)
In the equation, EFP stands for ecological footprint, αiEFPit—1 for ecological footprint lag value, δit stands for independent variables, and PT stands for the number of lags.
4. EMPIRICAL RESULTS
Table 2 outlines the descriptive statistics of the dataset. The standard deviations for all variables fall within an acceptable range, indicating a normal distribution and absence of outliers. Table 3 displays the correlation matrix, revealing no signs of multicollinearity among the variables, as all VIF values remain below 10 and correlation coefficients are under 0.8. Given the potential for cross-sectional dependence (CSD), the application of second-generation econometric techniques is deemed appropriate. To confirm the suitability of either first- or second-generation methods, a CSD test was conducted, with results shown in Table 4. The findings are mixed; while most series exhibit significant cross-sectional dependence, ecological footprint appears cross-sectionally independent. As a result, a mixed methodological approach was adopted. First-generation unit root tests were applied alongside estimations of long-run elasticities using the Generalized Method of Moments (GMM), which does not account for cross-sectional dependence and therefore belongs to the first-generation category. Table 5 presents the unit root test results of Levin et al. (2002) and Im et al. (2003), showing that all variables are stationary either at level or first difference, except for financial inclusion, which becomes stationary at second difference.
|
Table.2 |
Descriptive statistics. |
|
||
|
Variables |
Mean |
SD |
Min |
Max |
|
LNEFP |
0.122 |
0.827 |
—2.306 |
1.356 |
|
LNY |
7.77 |
1. |
5.623 |
10.417 |
|
FI |
0.298 |
1.085 |
—0.732 |
4.32 |
|
LNEC |
6.752 |
0.856 |
4.912 |
8.597 |
|
LNURB |
3.868 |
0.377 |
3.077 |
4.406 |
|
LNTO |
3.973 |
0.448 |
3.031 |
5.349 |
|
LNFD |
3.4692 |
0.6982 |
1.8165 |
5.0218 |
Table.3 Correlation matrix.
|
Variables |
LNEFP |
LNY |
FII |
LNFD |
LNEC |
LNURB |
LNTO |
VIF |
|
LNEFP |
1.0000 |
|
|
|
|
|
|
|
|
LNY |
—0.0620 |
1.0000 |
|
|
|
|
|
7.3520 |
|
FII |
0.0180 |
0.7470 |
1.0000 |
|
|
|
|
3.1780 |
|
LNFD |
0.0000 |
0.3450 |
0.5120 |
1.0000 |
|
|
|
3.0310 |
|
LNEC |
0.1500 |
0.7790 |
0.7220 |
0.3960 |
1.0000 |
|
|
5.9990 |
|
LNURB |
0.0170 |
0.7310 |
0.6470 |
0.1670 |
0.7720 |
1.0000 |
|
7.3110 |
|
LNTO |
0.1760 |
0.1930 |
0.1670 |
0.6740 |
0.2120 |
0.0440 |
1.0000 |
2.1250 |
|
Table.4 |
Outcomes of cross-sectional dependence test. |
|
|
Variables |
CD-test |
Significance |
|
LNEFP |
—0.260 |
.794 |
|
LNY |
22.990 |
.000 |
|
FI |
13.570 |
.000 |
|
LNEC |
2.470 |
.014 |
|
LNURB |
23.960 |
.000 |
|
LNTO |
1.720 |
.086 |
|
LNFD |
4.110 |
.000 |
Table.5 Results of unit root test.
|
Lavin, Lin, and Chu Im, Pesaran, Shin Level 1st difference Level 1st difference |
|||||||||||
|
|
Statistics |
p-value |
|
Statistics |
p-value |
|
Statistics |
p-value |
|
Statistics |
p-value |
|
LNEFP |
—0.6048 |
.2727 |
|
—9.0090 |
.0000 |
|
0.5580 |
.7116 |
|
—8.3215 |
.0000 |
|
LNY |
0.2535 |
.6001 |
|
—7.9295 |
.0000 |
|
2.0512 |
.9799 |
|
—7.6260 |
.0000 |
|
FI |
0.4873 |
.6870 |
|
—3.0187 |
.0002 |
|
0.8651 |
.8065 |
|
—5.0936 |
.0000 |
|
LNEC |
—3.2103 |
.0007 |
|
—11.1575 |
.0000 |
|
—0.6289 |
.2647 |
|
—11.0879 |
.0000 |
|
LNURB |
—8.9151 |
.0000 |
|
—4.0714 |
.0000 |
|
—2.2770 |
.0114 |
|
—3.0513 |
.0011 |
|
LNTO |
—1.4156 |
.0784 |
|
—9.5624 |
.0000 |
|
—0.7255 |
.2341 |
|
—11.4028 |
.0606 |
|
LNFD |
—4.7815 |
.0010 |
|
—5.8486 |
.0000 |
|
—2.5379 |
.0056 |
|
—7.5534 |
.0000 |
Note: FII D (2) = LLC (0.8065, 0.0000), IPS (—7.95326, 0.0000).
|
Table 6 |
Outcomes of CIPS test. |
|
|
|
Variables |
|
1 (0) |
1 (1) |
|
LNEFP |
|
—1.259 |
—4.765* |
|
LNY |
|
—1.858 |
—3.98* |
|
FII |
|
—1.168 |
—2.624* |
|
LNEC |
|
—1.161 |
—4.305* |
|
LNURB |
|
—1.555 |
—2.456* |
|
LNTO |
|
—1.641 |
—4.698* |
|
LNFD |
|
—1.553 |
—4.040* |
Note: A single asterisk (*) refers to levels of significance at 1%.
|
Table.7 |
Outcomes of Westerlund co-integration test. |
|
|
|
|
Value |
Z value |
p-value |
|
Gt |
—6.48 |
—13.956 |
.000 |
|
Ga |
—0.855 |
4.964 |
1.000 |
|
Pt |
—21.629 |
—12.953 |
.000 |
|
Pa |
—0.97 |
2.945 |
.998 |
Table. 8 Outcomes of dynamic common correlated effect (DCCE) estimation.
|
Variables |
Coefficient |
SE |
p value |
|
LNEFP (1) |
—0.089 |
0.19 |
.638 |
|
LNY |
17.91 |
8.362 |
.032 |
|
LNY2 |
—0.971 |
0.456 |
.033 |
|
FI |
—0.086 |
0.159 |
.590 |
|
FD |
0.73 |
0.353 |
.039 |
|
LNEC |
—0.411 |
0.207 |
.047 |
|
LNURB |
—3.313 |
5.217 |
.525 |
|
LNTO |
0.196 |
0.209 |
.348 |
Meanwhile, Table 6 presents the results of the cross-sectional dependence unit root tests, indicating that, except for financial inclusion, all variables achieve stationarity at first difference.
Prior to estimating long-run relationships, it is essential to determine the existence of co-integration among the variables. For this purpose, the Westerlund panel co-integration test was employed. The test results in Table 7 show that both the group (Gt) and panel (Pt) statistics are significant at the 1% level, confirming long-run co-integration. Similar outcomes were reported by Zaidi et al. (2021) when examining the impact of financial inclusion on environmental degradation in selected OECD countries. Hence, the null hypothesis of no co-integration is rejected, indicating a long-run equilibrium relationship among ecological footprint and the explanatory variables. Following the confirmation of co-integration, long-run elasticities were estimated using both DCCE and GMM techniques to assess the magnitude and direction of influence on ecological footprint, thereby evaluating whether the selected variables degrade environmental quality.
The DCCE estimation results, as reported in Table 8, reveal that ecological footprint (EFP) does not exhibit lag dependency. However, economic growth exerts a positive influence on ecological footprint. These findings are consistent with previous studies by Saqib et al. (2023), Alola et al. (2019), and Ozkan et al. (2023), who similarly found that heightened economic activity at both micro and macro levels is associated with increased ecological stress. To test the Environmental Kuznets Curve (EKC) hypothesis, the squared term of income is included and found to be negatively associated with EFP. This supports the presence of an inverted U-shaped EKC relationship in the Next-11 countries during the study period, where ecological footprint initially increases with rising income but eventually declines. These results are aligned with those of Chaudhry et al. (2022), who also identified an inverted U-shaped association in their extended EKC framework.
Table 9. Outcomes of generalized method of moments (GMM) estimation.
|
Variables |
Coefficients |
SE |
t-value |
p-value |
|
LNEFP_1 |
0.672 |
0.072 |
9.31 |
.000 |
|
LNY |
0.616 |
0.327 |
1.88 |
.062 |
|
LNY2 |
—0.041 |
0.02 |
—2.05 |
.043 |
|
FII |
—0.058 |
0.024 |
—2.45 |
.015 |
|
FD |
0.024 |
0.041 |
0.58 |
.564 |
|
LNEC |
—0.042 |
0.111 |
—0.38 |
.703 |
|
LNURB |
0.325 |
0.379 |
0.86 |
.393 |
|
LNTO |
0.058 |
0.062 |
0.94 |
.349 |
Sargan test ( p-value) = .010 AR1 ( p-value) = .000, AR2 ( p-value) = .015
Although financial inclusion shows a negative effect on the ecological footprint (EFP), this impact is statistically insignificant. Specifically, a 1% increase in financial inclusion corresponds to an 8% decline in EFP; however, the statistical analysis indicates that this relationship lacks significance. Chaudhry et al. (2022) similarly reported a negative association between financial inclusion and ecological footprint among OIC countries. Based on these findings, it can be inferred that financial inclusion does not exacerbate environmental degradation in Next-11 countries. Instead, greater financial inclusion may contribute to reduced environmental vulnerability to climate change. This suggests that financial inclusion could serve as a mitigating factor in controlling ecological degradation. The results further align with the objectives of the “Agenda 2030” Sustainable Development Goals (SDGs), which identify financial inclusion as a key mechanism for achieving sustainability. This perspective underscores the role of financial inclusion in fostering equity and promoting technological advancements that enable the development of environmentally friendly technologies and the adoption of green energy solutions. Thus, enhanced financial inclusion may offer a pathway to address environmental challenges effectively.
The study also incorporates financial development to evaluate its simultaneous effect alongside financial inclusion. The findings reveal that financial development significantly contributes to the expansion of EFP in these countries, echoing the conclusions drawn by previous scholars (Khan et al., 2021; Sharma et al., 2020). This indicates that greater access to credit may lead to increased demand for high-quality housing, expanded infrastructure, and higher consumption of energy-intensive appliances and consumer goods. Consequently, such trends contribute to the depletion of natural resources and disruption of ecological systems, thereby increasing the ecological footprint.
Regarding energy consumption, the results indicate a significant negative effect on the ecological footprint, which may be attributed to a growing reliance on renewable energy sources. This observation is consistent with prior research by Ozkan et al. (2023). Conversely, the effects of urbanization and trade openness on EFP are found to be statistically insignificant, in line with findings by Nathaniel et al. (2020) and Dogan et al. (2019).
Given the cross-sectional dependence test revealed statistically insignificant results for ecological footprint, the study additionally employed the difference system GMM method. This approach offers robust estimations for linear functional relationships, especially in datasets with shorter time periods (Ibrahim & Law, 2014). However, a key limitation of this dynamic model is its inability to account for cross-sectional dependence. As shown in Table 9, the GMM results demonstrate that financial inclusion negatively and significantly affects EFP, while financial development shows a positive but statistically insignificant impact—findings that closely mirror the outcomes derived from the DCCE model. In summary, the evidence suggests that it is financial development, particularly credit expansion, that contributes to environmental degradation, rather than the broader accessibility and inclusiveness of financial services.
5. Conclusion and Policy Recommendations
This study investigated the influence of financial inclusion and financial development on the ecological footprint (EFP) of the Next-11 countries during the period 1995 to 2019. It also examined the roles of energy consumption, urbanization, economic growth, and trade openness as essential control variables through the application of both first- and second-generation econometric techniques. The findings demonstrate a negative relationship between financial inclusion and EFP, suggesting that greater access to financial services can help reduce environmental degradation. Conversely, financial development appears to exacerbate environmental issues in the Next-11 countries by expanding the ecological footprint. Similarly, economic growth is associated with environmental degradation, though the presence of the income squared term validates the Environmental Kuznets Curve (EKC) hypothesis.
These negative environmental effects should not be interpreted as a call to restrict economic growth or financial development. Rather, they underscore the need to redirect financial and economic expansion towards environmentally sustainable pathways through comprehensive reforms at both macroeconomic and microeconomic levels. This research provides valuable insights for policymaking in this context.
Financial inclusion remains a pivotal instrument for achieving the United Nations Sustainable Development Goals (SDGs). However, recent empirical evidence questions the universal applicability of its benefits. Effective financial inclusion policies aimed at fostering sustainable development must be accompanied by transformative measures that include community engagement, the integration of traditional knowledge and institutional frameworks, supportive government policies, and technological innovation. Additionally, climate finance should be significantly expanded to support marginalized and economically disadvantaged groups, enabling them to adopt low-EFP practices.
Financial services and products should be designed to empower individuals and small and medium-sized enterprises (SMEs) to undertake local-scale climate mitigation and adaptation strategies. The financial sector, for example, should enhance the provision of green credit facilities to reduce environmental pollution, promote sustainable development, and support the transition to a green economy.
To align financial development with environmental sustainability, the financial sector must play a proactive role in supporting green growth. Central banks, as custodians of financial stability, should incorporate environmental and climate risks into their regulatory frameworks. National governments can employ policy instruments such as tax incentives and subsidies to promote renewable energy initiatives—similar to how the United States has used production and investment tax credits to stimulate solar energy deployment. These credits can allow firms to offset tax liabilities associated with renewable investments. Furthermore, non-bank financial institutions, including pension funds and insurance companies with long-term capital, should be encouraged to invest in sustainable infrastructure.
The issuance and promotion of green financial instruments—such as green bonds and green credit—must also be expanded. Regulatory bodies should synchronize financial inclusion strategies with environmental protection policies. Public–private partnership models should be employed to foster environmentally sustainable projects and support the achievement of the SDGs.
In parallel, the Next-11 countries should encourage financial institutions to prioritize investments that align with sustainable development goals. Policy frameworks must be implemented and reinforced to promote environmentally responsible business practices. Fiscal incentives should also be offered to enterprises that adopt eco-friendly approaches. Furthermore, public awareness campaigns should enhance financial and environmental literacy to increase citizen engagement with sustainable financial practices. National development plans should integrate environmental priorities into financial sector strategies.
Lastly, these economies should promote energy efficiency in urban areas and facilitate the adoption of renewable energy technologies through targeted financial incentives.
Despite the significant findings, the study acknowledges certain limitations, particularly the unavailability of financial inclusion data prior to 2004. Future research should consider using more recent data to update the analysis. Comparative studies involving both developing and developed nations could also enrich the findings, given the structural differences in financial systems. Moreover, the extended EKC framework could be strengthened by incorporating additional indicators such as technological innovation, governance quality, and institutional effectiveness.
Conflict of Interest Statement
The authors declare that there are no competing interests or financial conflicts to disclose.
Data Availability Statement
The data supporting the findings of this study are available from the corresponding author upon reasonable request.
REFERENCES
Adebayo, T. S., Agyekum, E. B., Kamel, S., Zawbaa, H. M., & Altuntas¸, M. (2022). Drivers of environmental degradation in Turkey: Designing an SDG framework through advanced quantile approaches. Energy Reports, 8, 2008–2021. https://doi.org/10.1016/j.egyr.2022.01.020
Ahmad, M., & Satrovic, E. (2023). Relating fiscal decentralization and financial inclusion to environmental sustainability: Criti– cality of natural resources. Journal of Environmental Management, 325, 116633. https://doi.org/10.1016/J.JENVMAN. 2022.116633
Ahmed, Z., Asghar, M. M., Malik, M. N., & Nawaz, K. (2020). Moving towards a sustainable environment: The dynamic link- age between natural resources, human capital, urbanization, economic growth, and ecological footprint in China. Resources Policy, 67, 101677. https://doi.org/10.1016/j.resourpol.2020.101677
Akinsola, G. D., Awosusi, A. A., Kirikkaleli, D., Umarbeyli, S., Adeshola, I., & Adebayo, T. S. (2022). Ecological footprint, public-private partnership investment in energy, and financial development in Brazil: A gradual shift causality approach. Environmental Science and Pollution Research, 29(7), 10077–10090. https://doi.org/10.1007/S11356-021-15791-5/ METRICS
Ali, K., Jianguo, D., & Kirikkaleli, D. (2022). Modeling the natural resources and financial inclusion on ecological footprint: The role of economic governance institutions. Evidence from ECOWAS economies. Resources Policy, 79, 103115.
Ali, M., Hashmi, S. H., Nazir, M. R., Bilal, A., & Nazir, M. I. (2021). Does financial inclusion enhance economic growth? Empiri– cal evidence from the IsDB member countries. International Journal of Finance & Economics, 26(4), 5235–5258.
Alola, A. A., Bekun, F. V., & Sarkodie, S. A. (2019). The dynamic impact of trade policy, economic growth, fertility rate, renewable and non-renewable energy consumption on ecological footprint in Europe. Science of the Total Environment, 685, 702–709.
Anarfo, E. B., Abor, J. Y., Osei, K. A., & Gyeke-Dako, A. (2019). Financial inclusion and financial sector development in sub- Saharan Africa: A panel VAR approach. International Journal of Managerial Finance, 15(4), 444–463. https://doi.org/10. 1108/IJMF-07-2018-0205
Annamalaisamy, B., & Vepur Jayaraman, S. (2023). Renewable energy for sustainable development in Asia-Pacific region: Do foreign direct investment and regulatory quality matter? Sustainable Development, 31(1), 108–124. https://doi.org/10. 1002/SD.2377
Anwar, A., Sinha, A., Sharif, A., Siddique, M., Irshad, S., Anwar, W., & Malik, S. (2021). The nexus between urbanization, renewable energy consumption, financial development, and CO2 emissions: Evidence from selected Asian countries. Environment, Development and Sustainability, 24, 6556–6576. https://doi.org/10.1007/s10668-021-01716-2
Aracil, E., Gómez-Bengoechea, G., Moreno-de-Tejada, O., & Gonzalo, G. (2022). Institutional quality and the financial inclusion-poverty alleviation link: Empirical evidence across countries. Borsa Istanbul Review, 22(1), 179–188. https:// doi.org/10.1016/j.bir.2021.03.006
Chaudhry, I. S., Yusop, Z., & Habibullah, M. S. (2022). Financial inclusion-environmental degradation nexus in OIC countries: New evidence from environmental Kuznets curve using DCCE approach. Environmental Science and Pollution Research, 29(4), 5360–5377. https://doi.org/10.1007/s11356-021-15941-9
Chibba, M. (2009). Financial inclusion, poverty reduction and the millennium development goals. European Journal of Devel– opment Research, 21(2), 213–230. https://doi.org/10.1057/ejdr.2008.17
Destek, M. A., Og˘uz, _I. H., & Okumus¸, N. (2023). Do trade and financial cooperation improve environmentally sustainable
development: A distinction between de facto and de jure globalization. Evaluation Review, 48, 251–273.
Destek, M. A., & Sinha, A. (2020). Renewable, non-renewable energy consumption, economic growth, trade openness and ecological footprint: Evidence from organisation for economic Co-operation and development countries. Journal of Cleaner Production, 242, 118537. https://doi.org/10.1016/j.jclepro.2019.118537
Destek, M. A., Sinha, A., Ozsoy, F. N., & Zafar, M. W. (2023). Capital flow and environmental quality at crossroads: Designing a sustainable policy framework for the newly industrialized countries. Environmental Science and Pollution Research, 30, 1–14.
Dinda, S. (2004). Environmental Kuznets curve hypothesis: A survey. Ecological Economics, 49(4), 431–455. https://doi.org/ 10.1016/j.ecolecon.2004.02.011
Dogan, E., Taspinar, N., & Gokmenoglu, K. K. (2019). Determinants of ecological footprint in MINT countries. Energy & Envi– ronment, 30(6), 1065–1086.
Fareed, Z., Rehman, M. A., Adebayo, T. S., Wang, Y., Ahmad, M., & Shahzad, F. (2022). Financial inclusion and the environ- mental deterioration in eurozone: The moderating role of innovation activity. Technology in Society, 69, 101961. https:// doi.org/10.1016/J.TECHSOC.2022.101961 Global footprint network. https://www.footprintnetwork.org/
Gokmenoglu, K. K., Taspinar, N., & Rahman, M. M. (2021). Military expenditure, financial development and environmental degradation in Turkey: A comparison of CO2 emissions and ecological footprint. International Journal of Finance and Eco- nomics, 26(1), 986–997. https://doi.org/10.1002/ijfe.1831
Grossman, G. M., & Krueger, A. B. (1995). Economic growth and the environment. Gene, 110(2), 353–377. http://www.jstor. org/stable/2118443
Guo, M., Hu, Y., & Yu, J. (2019). The role of financial development in the process of climate change: Evidence from different panel models in China. Atmospheric Pollution Research, 10(5), 1375–1382. https://doi.org/10.1016/j.apr.2019.03.006
Huang, Y., Haseeb, M., Usman, M., & Ozturk, I. (2022). Dynamic association between ICT, renewable energy, economic com-plexity and ecological footprint: Is there any difference between E-7 (developing) and G-7 (developed) countries? Tech- nology in Society, 68, 101853. https://doi.org/10.1016/J.TECHSOC.2021.101853
Hussain, M., Ye, C. C., Ye, C. C., & Wang, Y. (2021). Impact of financial inclusion and infrastructure on ecological footprint in OECD economies. Environmental Science and Pollution Research, 29(15), 21891–21898. https://doi.org/10.1007/ S11356-021-17429-Y
Ibrahim, M. H., & Law, S. H. (2014). Social capital and CO2 emission – output relations: A panel analysis. Renewable and Sus– tainable Energy Reviews, 29, 528–534. https://doi.org/10.1016/j.rser.2013.08.076
Im, K. S., Pesaran, M. H., & Shin, Y. (2003). Testing for unit roots in heterogeneous panels. Journal of Econometrics, 115(1), 53–74.
Kara, A., Zhou, H., & Zhou, Y. (2021). Achieving the United Nations’ sustainable development goals through financial inclu– sion: A systematic literature review of access to finance across the globe. International Review of Financial Analysis, 77, 101833. https://doi.org/10.1016/J.IRFA.2021.101833
Khan, M. K., Abbas, F., Godil, D. I., Sharif, A., Ahmed, Z., & Anser, M. K. (2021). Moving towards sustainability: How do natu– ral resources, financial development, and economic growth interact with the ecological footprint in Malaysia? A dynamic ARDL approach. Environmental Science and Pollution Research, 28(39), 55579–55591. https://doi.org/10.1007/s11356- 021-14686-9
Khan, M. T. I., Yaseen, M. R., & Ali, Q. (2019). Nexus between financial development, tourism, renewable energy, and green- house gas emission in high-income countries: A continent-wise analysis. Energy Economics, 83, 293–310. https://doi. org/10.1016/j.eneco.2019.07.018
Kuada, J. (2019). Financial inclusion and the sustainable development goals. In Extending Financial Inclusion in Africa
(pp. 259–277). Academic Press. https://doi.org/10.1016/B978-0-12-814164-9.00012-8
Le, T.-H., Le, H.-C., & Taghizadeh-Hesary, F. (2020). Does financial inclusion impact CO2 emissions? Evidence from Asia.
Finance Research Letters, 34, 101451. https://doi.org/10.1016/j.frl.2020.101451
Levin, A., Lin, C.-F., & Chu, C.-S. J. (2002). Unit root tests in panel data: Asymptotic and fnite-sample properties. Journal of Econometrics, 108, 1–24. https://doi.org/10.1016/S0304-4076(01)00098-7
Liu, D., Xie, Y., Hafeez, M., & Usman, A. (2022). The trade-off between economic performance and environmental quality: Does financial inclusion matter for emerging Asian economies? Environmental Science and Pollution Research, 29(20), 29746–29755. https://doi.org/10.1007/S11356-021-17755-1
Liu, H., Sinha, A., Destek, M. A., Alharthi, M., & Zafar, M. W. (2022). Moving toward sustainable development of sub-Saharan African countries: Investigating the effect of financial inclusion on environmental quality. Sustainable Development, 30(6), 2015–2024.
Mahjabeen, Shah, S. Z. A., Chughtai, S., & Simonetti, B. (2020). Renewable energy, institutional stability, environment and economic growth nexus of D-8 countries. Energy Strategy Reviews, 29, 100484. https://doi.org/10.1016/j.esr.2020. 100484
Mehmood, U. (2021). Examining the role of financial inclusion towards CO2 emissions: Presenting the role of renewable energy and globalization in the context of EKC. Environmental Science and Pollution Research, 29(11), 15946–15954. https://doi.org/10.1007/S11356-021-16898-5
Mehmood, U. (2022). Environmental degradation and financial development: Do institutional quality and human capital make a difference in G11 nations? Environmental Science and Pollution Research, 29(25), 38017–38025. https://doi.org/ 10.1007/S11356-022-18825-8/METRICS
Miao, Y., Razzaq, A., Adebayo, T. S., & Awosusi, A. A. (2022). Do renewable energy consumption and financial globalisation contribute to ecological sustainability in newly industrialized countries? Renewable Energy, 187, 688–697. https://doi. org/10.1016/j.renene.2022.01.073
Mrabet, Z., & Alsamara, M. (2017). Testing the Kuznets curve hypothesis for Qatar: A comparison between carbon dioxide and ecological footprint. Renewable and Sustainable Energy Reviews, 70, 1366–1375. https://doi.org/10.1016/j.rser. 2016.12.039
Murshed, M., Khan, U., Khan, A. M., & Ozturk, I. (2022). Can energy productivity gains harness the carbon dioxide-inhibiting agenda of the next 11 countries? Implications for achieving sustainable development. Sustainable Development, 31, 307–320.
Nassani, A. A., Moinuddin, M., Abro, Q., Batool, R., Haider, S., Shah, A., Hyder, S., & Zaman, K. (2020). Go-for-green policies: The role of finance and trade for sustainable development. https://doi.org/10.1002/ijfe.1855
Nathaniel, S., & Khan, S. A. R. (2020). The nexus between urbanization, renewable energy, trade, and ecological footprint in ASEAN countries. Journal of Cleaner Production, 272, 122709. https://doi.org/10.1016/j.jclepro.2020.122709
Nathaniel, S., Nwodo, O., Adediran, A., Sharma, G., Shah, M., & Adeleye, N. (2019). Ecological footprint, urbanization, and energy consumption in South Africa: Including the excluded. Environmental Science and Pollution Research, 26(26), 27168–27179. https://doi.org/10.1007/s11356-019-05924-2
Nathaniel, S., Nwodo, O., Sharma, G., & Shah, M. (2020). Renewable energy, urbanization, and ecological footprint linkage in CIVETS. Environmental Science and Pollution Research, 27, 19616–19629.
O’Neill, J., Wilson, D., & Stupnytska, A. (2005). Global Economics Paper No : 134 How Solid are the BRICs ? Goldman Sachs Global Research Centres, December, 1–24.
Ouyang, X., Shao, Q., Zhu, X., He, Q., Xiang, C., & Wei, G. (2019). Environmental regulation, economic growth and air pollu– tion: Panel threshold analysis for OECD countries. Science of the Total Environment, 657, 234–241. https://doi.org/10. 1016/j.scitotenv.2018.12.056
Ozkan, O., Khan, N., & Ahmed, M. (2023). Impact of green technological innovations on environmental quality for Turkey: Evidence from the novel dynamic ARDL simulation model. Environmental Science and Pollution Research, 30, 1–17.
Park, Y., Meng, F., & Baloch, M. A. (2018). The effect of ICT, financial development, growth, and trade openness on CO2 emissions: An empirical analysis. Environmental Science and Pollution Research, 25(30), 30708–30719. https://doi.org/10. 1007/s11356-018-3108-6
Pesaran, M. H. (2007). A simple panel unit root test in the presence of cross-section dependence. Journal of Applied Econo– metrics, 22, 265–312. https://doi.org/10.1002/jae
Pesaran, M. H. (2015). Testing weak cross-sectional dependence in large panels. Econometric Reviews, 34(6–10), 1089– 1117. https://doi.org/10.1080/07474938.2014.956623
Pesaran, M. H., Pesaran, M. H., Shin, Y., & Smith, R. P. (1999). Pooled mean group estimation of dynamic heterogeneous panels. Journal of the American Statistical Association, 94(446), 621–634. https://doi.org/10.1080/01621459.1999. 10474156
Pesaran, M. H., & Smith, R. (1995). Estimating long-run relationships from dynamic heterogeneous panels. Journal of Econo– metrics, 68(1), 79–113. https://doi.org/10.1016/0304-4076(94)01644-F
Pradhan, R. P., Arvin, M. B., Nair, M. S., Hall, J. H., & Bennett, S. E. (2021). Sustainable economic development in India: The dynamics between financial inclusion, ICT development, and economic growth. Technological Forecasting and Social Change, 169, 120758.
Pradhan, R. P., & Sahoo, P. P. (2021). Are there links between financial inclusion, mobile telephony, and economic growth?
Evidence from Indian states. Applied Economics Letters, 28(4), 310–314.
Qin, L., Raheem, S., Murshed, M., Miao, X., Khan, Z., & Kirikkaleli, D. (2021). Does financial inclusion limit carbon dioxide emissions? Analyzing the role of globalization and renewable electricity output. Sustainable Development, 29(6), 1138– 1154. https://doi.org/10.1002/sd.2208
Raza, S. A., Shah, N., & Khan, K. A. (2020). Residential energy environmental Kuznets curve in emerging economies: The role of economic growth, renewable energy consumption, and financial development. Environmental Science and Pollution Research, 27, 5620–5629.
Rehman, M. A., Fareed, Z., & Shahzad, F. (2022). When would the dark clouds of financial inclusion be over, and the environ- ment becomes clean? The role of national governance. Environmental Science and Pollution Research, 29(19), 27651– 27663. https://doi.org/10.1007/S11356-021-17683-0/TABLES/9
Saqib, N., Ozturk, I., & Usman, M. (2023). Investigating the implications of technological innovations, financial inclusion, and renewable energy in diminishing ecological footprints levels in emerging economies. Geoscience Frontiers, 14(6), 101667.
Shahbaz, M., Li, J., Dong, X., & Dong, K. (2022). How financial inclusion affects the collaborative reduction of pollutant and carbon emissions: The case of China. Energy Economics, 107, 105847. https://doi.org/10.1016/J.ENECO.2022.105847
Sharma, R., Sinha, A., & Kautish, P. (2020). Does financial development reinforce environmental footprints? Evidence from emerging Asian countries. Environmental Science and Pollution Research, 28(8), 9067–9083. https://doi.org/10.1007/ s11356-020-11295-w
Sherif, M., Ibrahiem, D. M., & El, K. M. (2022). Investigating the potential role of innovation and clean energy in mitigating the ecological footprint in N11 countries. Environmental Science and Pollution Research, 29, 32813–32831. https://doi. org/10.1007/s11356-021-18477-0
Usman, M., & Balsalobre-Lorente, D. (2022). Environmental concern in the era of industrialization: Can financial develop- ment, renewable energy and natural resources alleviate some load? Energy Policy, 162, 112780. https://doi.org/10. 1016/J.ENPOL.2022.112780
Usman, M., Chughtai, S., Rashid, A., & Khan, N. (2023). Disaggregated financial development and ecological sustainability: The critical role of urbanization, energy utilization, and economic growth in next 11 economies. Environment, Develop- ment and Sustainability, 26, 11455–11474. https://doi.org/10.1007/s10668-023-03368-w
Uzar, U. (2021). The relationship between institutional quality and ecological footprint: Is there a connection? Natural Resources Forum, 45(4), 380–396.
Valencia, D. C., Calabuig, C., Villa, E., & Betancur, F. (2021). Financial inclusion as a complementary strategy to address the SDGs for society. 79–89. https://doi.org/10.1007/978-3-030-70948-8_6
Van, L. T.-H., Vo, A. T., Nguyen, N. T., & Vo, D. H. (2021). Financial inclusion and economic growth: An international evi– dence. Emerging Markets Finance and Trade, 57(1), 239–263.
Wang, J., You, S., Agyekum, E. B., Matasane, C., & Uhunamure, S. E. (2022). Exploring the impacts of renewable energy, envi– ronmental regulations, and democracy on ecological footprints in the next eleven nations. Sustainability, 14(19), 11909.
Wang, Q., Wang, L., & Li, R. (2023). Trade protectionism jeopardizes carbon neutrality – Decoupling and breakpoints roles of trade openness. Sustainable Production and Consumption, 35, 201–215. https://doi.org/10.1016/j.spc.2022.08.034 Wang, W., Rehman, M. A., & Fahad, S. (2022). The dynamic influence of renewable energy, trade openness, and industriali-zation on the sustainable environment in G-7 economies. Renewable Energy, 198, 484–491. https://doi.org/10.1016/J. RENENE.2022.08.067
Westerlund, J., & Edgerton, D. L. (2008). A simple test for cointegration in dependent panels with structural breaks. Oxford Bulletin of Economics and Statistics, 70(5), 665–704. https://doi.org/10.1111/j.1468-0084.2008.00513.x
Yilanci, V., & Kilci, E. N. (2021). The Feldstein-Horioka puzzle for the next eleven countries: A panel data analysis with Fou– rier functions. Journal of International Trade and Economic Development, 30(3), 341–364. https://doi.org/10.1080/ 09638199.2021.1879901
Zaidi, S. A. H., Hussain, M., & Uz Zaman, Q. (2021). Dynamic linkages between financial inclusion and carbon emissions: Evi– dence from selected OECD countries. Resources, Environment and Sustainability, 4(March), 100022. https://doi.org/10. 1016/j.resenv.2021.100022
Zeng, Q., Destek, M. A., Khan, Z., Badeeb, R. A., & Zhang, C. (2023). Green innovation, foreign investment and carbon emis– sions: A roadmap to sustainable development via green energy and energy efficiency for BRICS economies. International Journal of Sustainable Development & World Ecology, 31, 191–205.
Zeraibi, A., Balsalobre-Lorente, D., & Murshed, M. (2021). The influences of renewable electricity generation, technological innovation, financial development, and economic growth on ecological footprints in ASEAN-5 countries. Environmental Science and Pollution Research, 28(37), 51003–51021. https://doi.org/10.1007/s11356-021-14301-x
Zeraibi, A., Jahanger, A., Sunday Adebayo, T., Ramzan, M., & Yu, Y. (2023). Greenfield investments, economic complexity, and financial inclusion-environmental quality nexus in BRICS countries: Does renewable energy transition matter? Gond- wana Research, 117, 139–154. https://doi.org/10.1016/j.gr.2022.12.020.