Dr. Maria Schneider ¹*, Prof. David Mensah², Dr. Lin Wei³
1Department of Health Economics and Policy, Institute for Public Health Research, University of Vienna, Austria
2Centre for Health Systems and Equity Studies, School of Social and Economic Sciences, University of Cape Town, South Africa
3Institute for Global Health and Development, School of Public Policy, Tsinghua University, Beijing, China
*Corresponding Author:
Prof. David Mensah
Centre for Health Systems and Equity Studies, School of Social and Economic Sciences, University of Cape Town
Email: [email protected]
Abstract
This article reviews empirical research examining the progressivity and redistributive consequences of healthcare financing arrangements across different national contexts. The findings reveal substantial heterogeneity depending on both the financing approach and the country under consideration. Tax-based systems are generally the most progressive, as revenues generated from direct taxation tend to enhance redistribution in favor of lower-income households, partly counterbalancing the regressive effects associated with indirect taxation. Social health insurance mechanisms can display progressive tendencies; however, in practice, their redistributive capacity may be weakened by contribution caps and exemptions that disproportionately benefit higher earners. This creates inequities whereby affluent taxpayers secure social protection while contributing a smaller share of their overall income, thereby constraining reductions in income inequality. Moreover, cost-sharing schemes often rely on flat co-payment structures rather than income-adjusted contributions, placing heavier financial burdens on individuals with limited resources and increasing the risk of catastrophic health expenditures. The review also identifies a paucity of recent evidence from high-income countries, whereas new studies from low- and middle-income countries demonstrate alignment with global commitments to achieving universal health coverage. Ongoing evaluation of redistributive outcomes remains vital to ensure that healthcare financing not only secures adequate funding for health systems but also advances broader objectives of social equity.
Keywords: Equity, Healthcare financing, Health systems, Progressivity, Inequality, Redistribution
© The Author(s) 2025. Open Access This article is licensed under a Creative Commons Attribution-NonCommercial-NoDerivatives 4.0 International License, which permits any non-commercial use, sharing, distribution and reproduction in any medium or format, as long as you give appropriate credit to the original author(s) and the source, provide a link to the Creative Commons licence, and indicate if you modified the licensed material. You do not have permission under this licence to share adapted material derived from this article or parts of it. The images or other third-party material in this article are included in the article’s Creative Commons licence, unless indicated otherwise in a credit line to the material. If material is not included in the article’s Creative Commons licence and your intended use is not permitted by statutory regulation or exceeds the permitted use, you will need to obtain permission directly from the copyright holder. To view a copy of this licence, visit https://creativecommons.org/licenses/by-nc-nd/4.0/
Background
The structure of healthcare financing systems has profound implications for both social and economic equity. Financing mechanisms based on taxation or public contributions distribute healthcare costs across the population in proportion to ability to pay, often through progressive taxation. Such arrangements can reduce inequality by ensuring that all citizens, irrespective of socioeconomic status, have access to essential services. In contrast, systems that rely heavily on private financing—particularly out-of-pocket payments (OOPs)—tend to link access to care with financial capacity, thereby reinforcing pre-existing inequalities. High OOP expenditures are particularly burdensome for low-income households, frequently driving them further into poverty and intensifying overall income disparities. Conversely, financing structures characterized by lower OOPs or more comprehensive coverage alleviate financial stress among vulnerable populations and contribute to income redistribution.
This review examines the progressivity of healthcare financing mechanisms and their broader redistributive effects on society. Equity in financing is fundamental to the fairness of a healthcare system, as it ensures that resources are allocated in accordance with need rather than income. Beyond immediate financial protection, equitable financing also generates longer-term benefits by reducing barriers to healthcare access. Greater access, particularly among lower-income groups, contributes to improved health outcomes, which in turn support educational attainment, productivity, and socioeconomic mobility. Thus, healthcare financing influences not only equity in access to services but also equity in health outcomes and opportunities. While this article focuses on the relationship between healthcare payments and income or ability to pay, it does not address the direct health benefits of increased service utilization (for which reviews exist [1,2]). Indirect pathways linking health and income—such as the impact of childhood health on education [3], the relationship between health and earnings [4], and the role of ill-health in perpetuating poverty [5]—have also been discussed in this special issue.
Drawing on evidence from 57 peer-reviewed studies, this narrative review traces the evolution of equity-focused research in healthcare financing. Initial work from the late 1990s concentrated on high-income countries (HICs) [[6]–[12]], later extending to LMICs in the Asia-Pacific region [[13]–[15]], and more recently, to other global contexts [[16]–[19]]. Across these studies, substantial heterogeneity emerges in both the progressivity and redistributive capacity of financing sources. Direct taxation is consistently progressive, placing proportionately smaller financial burdens on low-income households. Indirect taxes, however, generally prove regressive, while OOPs are universally regressive, with particularly severe consequences in LMICs. The effects of social health insurance and private insurance are more variable, shaped largely by country-specific policies and institutional frameworks. Collectively, this evidence underscores the importance of equity-focused reforms in healthcare financing. Systems built on progressive taxation and robust public funding are most effective in reducing income inequalities, while also delivering critical financial protection to populations most vulnerable to catastrophic health expenditures.
-
Research Methodology
A targeted literature search was conducted focusing on publications released after the seminal work of Wagstaff et al. [20] on equity in healthcare financing. The primary objective was to identify empirical studies that assessed the influence of health financing arrangements on income inequality. Search terms combined healthcare-related concepts with terms associated with income distribution and policy. Further details regarding the search strategy are available in Appendix A.
Titles and abstracts of all retrieved records were screened for relevance. Studies were included only if they met the following criteria: (1) written in English, (2) published in peer-reviewed journals or academic book chapters, (3) presenting empirical findings disaggregated by financing sources, and (4) utilizing index-based measures. No limits were applied regarding the period of publication; however, given the focus on empirical assessments of progressivity and redistributive effects of income taxation, the final selection primarily comprised works published after the foundational contributions [12,20,21]. In total, 57 studies were retained for detailed review.
Because the redistributive capacity of a healthcare financing arrangement depends not solely on its degree of progressivity but also on the extent of overall redistribution it produces [8], the reviewed studies were classified along these two dimensions. They were further grouped according to the principal sources of healthcare financing, in order to evaluate the protective effects of each system on household income. Three financing categories were examined: tax-based mechanisms, social health insurance, and private financing models, including private insurance premiums and out-of-pocket (OOP) expenditures.
-
Results
3.1. Conceptual Framework of Healthcare Financing
Healthcare systems are funded through multiple sources that vary across contexts. In tax-based arrangements, financing is derived from a mix of income taxes, sales taxes, or specific levies earmarked for health, whereas social health insurance relies on mandatory contributions from both employers and employees. Private financing encompasses premiums paid for private health insurance—by individuals or employers—and direct out-of-pocket (OOP) payments at the point of service.
It is useful to distinguish between three principal categories of contributions: (1) utilisation-related contributions, including OOP payments, cost-sharing mechanisms, and payments for uncovered services; (2) mandatory contributions unrelated to utilisation, such as taxes, per capita premiums, and income-based contributions; and (3) voluntary contributions, particularly voluntary health insurance, which may mitigate OOP expenses or broaden service coverage depending on the system.
Minimizing the financial hardship caused by healthcare expenses represents a universal policy priority, underscored by the Sustainable Development Goals (SDG 3, Target 3.8) and the pursuit of universal health coverage (UHC). Central to this goal is the principle of fairness in financial contributions, which emphasizes that healthcare payments should correspond to household income and ability to pay, rather than healthcare needs or service use. Progressive financing arrangements require wealthier households to bear a greater share of contributions, thereby narrowing post-tax income disparities through redistribution. Importantly, progressive mechanisms do not directly reduce pre-tax inequalities; instead, redistribution through taxation achieves greater equity. Moreover, the extension of UHC disproportionately benefits low-income groups, further advancing equity in healthcare financing. Publicly financed healthcare yields distributional effects distinct from those of private financing models [22]. Under tax-based systems, financial responsibilities are pooled across the entire population within a single framework. In contrast, risk pooling in social health insurance is more constrained, as contributions are commonly tied to income. Private insurance typically relies on risk-rated premiums, pooling only individuals with comparable risk levels, while direct payments at the point of service are solely linked to healthcare utilization and lack risk pooling altogether.
Two dimensions of equity in healthcare financing are of particular importance for policy development. The first is vertical equity, which concerns whether households with differing incomes contribute appropriately different amounts to healthcare funding [12]. Vertical equity is assessed by determining whether a financing mechanism is progressive (payments increase with income), regressive (payments decrease with income), or proportional (the share of income devoted to healthcare remains constant regardless of income). The standard measure for vertical equity is the Kakwani progressivity index, which quantifies deviations from proportionality [23]. This index is derived by comparing the Lorenz curve, which depicts cumulative pre-tax income distribution, with the concentration curve, which reflects the distribution of healthcare-related contributions (Fig. 1A). The 45° line denotes perfect equality, where each percentile of the population contributes or receives an equal share of income or taxes. The Kakwani index corresponds to the area between the two curves and equals the difference between the concentration index of healthcare payments and the Gini coefficient of pre-tax income. Its values range from −2 to 1. A positive value indicates progressivity, where payments are more evenly distributed than income, whereas a negative value signals regressivity. An index of 0 signifies proportionality, occurring when the two distributions coincide or intersect. In cases where progressivity applies to lower-income groups but regressivity affects higher-income groups (or vice versa), the index may also converge to zero. For this reason, it is advisable to complement Kakwani index estimates with a graphical illustration.
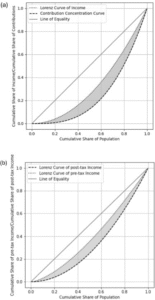
Fig. 1. Distributional impacts of healthcare financing. (A) Measurement of progressivity through the Kakwani index. (B) Assessment of the income redistribution effect.
One important characteristic of the Kakwani index is its capacity to capture the overall progressivity of a healthcare financing system as a weighted aggregation of the indices associated with individual financing components. Consequently, the composite progressivity index is shaped by the relative contribution of each mechanism—such as taxes, insurance premiums, and out-of-pocket (OOP) payments. Assessing each financing source independently provides insight into its specific role in shaping the system’s overall equity, thereby offering a more precise understanding of how various mechanisms influence vertical equity. In policy terms, progressivity is generally preferred, as it ensures that lower-income households contribute proportionally less than higher-income households. Conversely, systems in which poorer groups bear a proportionally greater financial burden than wealthier groups are typically regarded as inequitable and unacceptable. The progressivity of any financing source can thus be systematically assessed.
A second central concern involves the extent to which healthcare payments influence income distribution and income inequalities within a country [24]. Since healthcare utilisation is financed from household income—whether through prepayment mechanisms (taxes, social health insurance contributions, or private premiums) or direct payments such as co-payments and OOPs—health financing inherently interacts with income inequality. Equity in healthcare financing entails evaluating the redistributive characteristics of these mechanisms and understanding how different income groups contribute to the overall financing structure [20]. Under progressive systems, higher-income individuals allocate a larger share of their income toward financing healthcare, facilitating income redistribution from wealthier to poorer groups and thereby narrowing post-tax income disparities. In contrast, systems heavily reliant on OOPs disproportionately burden low-income households, deepening income inequalities rather than mitigating them.
From a graphical perspective, the income redistributive effect can be represented as the area between two Lorenz curves of income distribution—one before and the other after healthcare-related payments (Fig. 1B). This effect is quantified by the arithmetic difference between pre-payment and post-payment income inequality, each measured using the Gini coefficient. A positive value indicates a pro-poor redistribution, where post-payment inequality is reduced compared to pre-payment. Conversely, a negative value signals a pro-rich redistribution, while a value of zero corresponds to proportional redistribution.
It is essential to differentiate progressivity from redistribution. Progressivity evaluates the extent to which healthcare payments diverge from proportionality, whereas redistribution captures the actual impact of these payments on aggregate income inequalities. A progressive system does not automatically ensure reductions in inequality; the redistributive outcome ultimately depends on both the magnitude of payments and how they are distributed across income groups.
3.2. Vertical Implications of Healthcare Financing Sources
3.2.1. Tax-Financed Healthcare Systems
The literature generally examines the vertical implications of tax-financed healthcare separately for direct and indirect taxation. Direct taxes typically include income, corporate, vehicle, and profit taxes, while indirect taxes encompass value-added tax (VAT), excise duties, import tariffs, and levies on luxury goods.
Tax-based health financing systems, in which healthcare is primarily supported by direct and indirect taxation, are more prevalent in high-income countries (HICs) than in low- and middle-income countries (LMICs), where tax revenue collection and system sustainability often present challenges. Across all surveyed tax-financed health systems, the Kakwani index for direct taxation is consistently positive, reflecting a progressive structure. The strength of this progressivity varies: strong progressivity is observed in the UK, Ireland, and Germany, with an average Kakwani index of V = 0.27 across HICs [6,7]. Similarly, direct taxation in LMICs demonstrates progressivity; for example, Mauritius and Sierra Leone both report indices of V = 0.30 [17,25], while Argentina exhibits a positive effect of V = 0.22 [26]. This progressivity arises primarily from the design of tax brackets, whereby higher-income groups are subject to higher marginal rates, ensuring proportional contributions aligned with ability to pay.
In contrast, indirect taxes are consistently regressive in both HICs and LMICs, since consumption accounts for a larger share of income among low-income households. In HICs, Kakwani indices for indirect taxes range between V = −0.15 and V = −0.03, with the UK presenting the most regressive profile (V = −0.15) [27,28]. In LMICs, results are similar, ranging between V = −0.14 and V = −0.04 [16,17,25,26,29]. An exception is Egypt, where indirect taxes show progressivity (V = 0.14) due to their application exclusively to luxury items, with exemptions for basic consumption goods [30].
3.2.2. Social Health Insurance Systems
The progressivity of social health insurance (SHI) depends on how contributions are collected and the scope of coverage. Contributions are generally payroll-based [30], frequently subject to ceilings [29], which can limit overall progressivity compared to tax-based models [31].
In HICs, SHI systems are often mildly progressive, with Kakwani indices ranging from V = 0.01 to V = 0.02 [6]. However, regressivity is observed in some contexts, with indices between V = −0.0072 and V = −0.01, as in Germany, the Netherlands [6], Japan, South Korea, and Taiwan [32]. These outcomes largely result from exemptions for high-income earners and contribution ceilings, which reduce proportionality in financing.
In LMICs, SHI progressivity is closely linked to the transition toward universal health coverage (UHC) and the proportion of out-of-pocket (OOP) payments in total health spending. In China, for instance, the share of health financing from general taxation increased from 15.69% in 2002 to 22.31% in 2007, though the progressivity of SHI varied by region [33]. The Basic Medical Insurance scheme in cities and counties was progressive (V = 0.3900), while the New Rural Cooperative Medical Care System was regressive (V = −0.1400). These disparities stemmed primarily from uniform premium-setting policies. Rural enrollees paid flat contributions irrespective of ability to pay, resulting in a disproportionate burden on poorer groups, whereas urban schemes applied income-related premiums, ensuring greater equity. A comparable pattern emerged in Indonesia with the Jaminan Kesehatan Nasional scheme [29]. Following its introduction, the Kakwani index was regressive (V = −0.116) due to contributions fixed at 5% of monthly income, capped by a salary ceiling, which placed heavier relative burdens on poorer households.
In Palestine, government health insurance covers more than 60% of households and is slightly progressive (V = 0.1201 in the West Bank; V = 0.1100 in Gaza) [34]. However, the positive effect is offset by OOP payments—accounting for around 40% of expenditures—resulting in overall regressivity (V = −0.0680 in the West Bank; V = −0.0470 in Gaza) [34,35].
3.2.3. Private Healthcare Financing
Private financing mechanisms include private insurance premiums—paid by individuals or employers—and direct OOP payments at the point of service. Such mechanisms, particularly OOPs, are typically regressive, as poorer households spend a higher proportion of their income on healthcare and often experience greater need for care. The equity impact of private insurance depends on its role within the system.
Where private insurance constitutes a major source of healthcare financing, it tends to be moderately or strongly regressive, as lower-income households—being in poorer health—face relatively higher premiums. Where private insurance is supplementary, covering co-payments or offering expanded services, distributional effects vary. In systems where wealthier individuals opt out of SHI, private insurance may appear progressive, but when it is mandatory and premiums are unrelated to income, it is regressive.
OOP payments impose both direct and indirect constraints: they not only reduce disposable income but also act as barriers to access. This often results in forgone care or catastrophic health expenditures, especially among vulnerable groups, even within insured populations [36,37]. Although user charges can serve as short-term cost-containment tools, they undermine long-term equity and efficiency by delaying or deterring access to necessary services.
The application of the Kakwani index to private financing must be interpreted cautiously. While it captures progressivity or regressivity relative to income, it does not reflect access to care or the distribution of services across income groups. For example, in countries where private insurance is largely supplementary and concentrated among high-income households—such as Germany, Italy, Palestine, and South Africa—the Kakwani index is marginally positive, between V = 0.0013 and V = 0.019 [6,28,16,34]. This reflects the fact that wealthier groups purchase supplementary coverage, while lower-income groups rely on public schemes. Conversely, in contexts such as the US and Switzerland, where private insurance represents a substantial share of total coverage, the system is regressive, with indices between V = −0.0121 and V = −0.0080 [6,38]. In Switzerland, for instance, basic health insurance is compulsory for all residents but provided by private insurers [39].
OOP expenditures remain widely recognised as inequitable, particularly when they constitute a significant share of overall health spending. In HICs, these are consistently regressive. For instance, in Hungary, despite universal access, OOPs yield a negative Kakwani index (V = −0.22), with the poorest quintile spending 6–7% of income on healthcare compared to just 2% among the wealthiest [40]. Similarly, in Australia, where the healthcare system combines public and private financing, OOPs accounted for roughly $29.8 billion in 2019–2020. Measures such as bulk-billing and safety nets reduce the burden for low-income groups, but regressivity persists. One study [41] showed that OOPs as a share of disposable income fell from 1.16% in the lowest decile to 0.63% in the highest for Medicare Benefits Schedule (MBS) services, and from 1.35% to 0.35% for Pharmaceutical Benefits Scheme (PBS) medicines. Yet co-payments for MBS services still displayed mild regressivity (V = −0.06), while PBS medicines were highly regressive (V = −0.24).
In India, healthcare financing relies on a blend of public and private sources [43]. The public sector primarily serves populations unable to afford private services, while the private sector caters to those with greater financial means. Despite ongoing government initiatives to enhance public health funding, India’s public health expenditure remains comparatively low relative to similar nations, with a substantial share of health costs still covered through OOP payments. These OOPs disproportionately drive vulnerable households into poverty across all districts, with Kakwani indices ranging from V = −0.06 to V = −0.35. In every district, healthcare spending relative to income was regressive, with rural areas exhibiting particularly high levels of inequity. However, findings from several LMICs, including Cameroon, Chile, and Malaysia, suggest more favorable outcomes, with OOPs demonstrating positive Kakwani indices (between V = 0.03 and V = 0.09), indicating that higher-income households bear a larger share of private healthcare costs compared to lower-income groups [[42], [43], [44]]. In Cameroon, however, UHC remains incomplete. Although some public financing exists, healthcare costs remain heavily dependent on household co-payments, restricting access for the poorest and exacerbating inequities in service utilization. Wealthier households access more care, while poorer households frequently forgo essential treatment due to unaffordability.
Chile operates a mixed financing system that combines public and private health insurance [44]. Although Chile has formally achieved UHC, with approximately 72 % of the population insured under FONASA, low-income households still face substantial financial obstacles. Copayments and other indirect costs, which are not covered under insurance schemes, limit access for poorer groups, while wealthier individuals are able to take fuller advantage of the system.
Malaysia also follows a dual-tiered healthcare model, integrating public and private provision [43]. By 2019, an estimated 97 % of the Malaysian population had some form of health coverage, whether through the public or private sector. Yet, this dual system fosters inequalities in access and quality, with higher costs and perceived superior quality concentrated in private care. Low-income households frequently rely on subsidized public services, which may be overburdened or of variable quality, while affluent households preferentially access private facilities. Consequently, OOP spending tends to be concentrated among higher-income groups.
3.3. Income Redistribution from Healthcare Financing
The redistributive effect of a tax (denoted as RE) is determined by the gap between pre-tax and post-tax Gini coefficients. A positive RE suggests that the tax system reduces inequality, while a negative value indicates that it exacerbates inequality.
3.3.1. Tax-financed healthcare systems
In twelve OECD countries, tax-based financing systems exhibited positive redistributive effects, with progressive direct taxation offsetting the regressive nature of indirect taxes [6]. Such systems thus contribute to lowering income inequality. The pro-poor redistributive effect of tax-funded systems appears more pronounced in the US (RE = 0.0059) compared with tax-financed systems in European nations such as Finland (RE = 0.0044) and the UK (RE = 0.0035) [6,45]. This difference stems from Medicaid’s targeted design to support low-income groups in the US, while Finland and the UK implement universal healthcare systems extending benefits across the population. While universalism ensures access for all, it dilutes the pro-poor redistributive impact relative to targeted schemes. With reforms under the Affordable Care Act, disparities in regressivity may have narrowed, but despite these redistributive gains, the US healthcare system continues to rely heavily on private insurance and OOPs, sustaining significant inequalities [9,46,47].
In LMICs, direct taxation plays a pivotal role in income redistribution, though the effect of indirect taxes varies. In Zambia, redistribution is pro-poor for both direct (RE = 0.0053) and indirect (RE = 0.0046) taxes, with taxes comprising 60.8 % of total health financing, thus playing a crucial role in narrowing inequality [19]. Importantly, direct taxes are levied on a per capita basis, ensuring consistent payments regardless of household size. Positive redistributive effects of indirect taxation are also observed in Tanzania (RE = 0.07) and Ghana (RE = 0.01), where VAT exemptions on essential goods and progressive import duties benefit poorer households [38,48]. In South Africa, taxes constitute 38.2 % of healthcare financing. Direct taxation generates significant pro-poor redistribution (RE = 0.0072), while indirect taxation has a negative effect (RE = −0.0025). Nevertheless, the combined redistributive effect of total taxation remains positive, reducing income inequality overall (RE = 0.0048) [16]. Similarly, in Argentina, direct taxes demonstrated positive redistributive effects in both 1997 (RE = 0.2670) and 2002 (RE = 0.1870). The reduction over time reflects a decline in progressivity, driven by inflation that expanded the taxpayer base. The contribution of the wealthiest decile fell from 88.2 % of direct tax revenues in 1997 to 70.8 % in 2002. Conversely, indirect taxation widened inequalities, with negative redistributive effects (RE = −0.0920 in 1997 and RE = −0.1010 in 2002) [26]. The regressive outcome of indirect taxation arises from its uniform application across consumption goods and differences in household spending patterns.
In India, healthcare is financed through a mix of public and private sources [43]. The public sector primarily delivers care to populations unable to afford private services, whereas the private sector serves those with greater financial capacity. Despite government initiatives aimed at expanding public health investment, India’s public health expenditure remains comparatively low relative to peer countries, with OOP payments continuing to account for a substantial share of total health financing. These OOPs disproportionately push vulnerable households into poverty across all districts, with Kakwani indices ranging between V = −0.06 and V = −0.35. In every district, healthcare costs represented a higher relative burden for the poor, with inequities particularly pronounced in rural areas. In contrast, studies from several LMICs—including Cameroon, Chile, and Malaysia—report positive Kakwani indices (ranging from V = 0.03 to V = 0.09), indicating that wealthier households contribute more directly to private healthcare than poorer groups [[42], [43], [44]]. Unlike Chile and Malaysia, however, Cameroon has yet to attain comprehensive UHC. Although some public financing exists, household co-payments constitute a significant share of health funding, restricting access for the poorest and exacerbating inequities in utilization. Wealthier households consume more care, while poorer households often forgo essential treatment due to the financial burden.
Chile operates a mixed model of healthcare financing, combining both public and private insurance schemes [44]. Although the country has nominally achieved UHC—with approximately 72 % of citizens covered by FONASA—low-income households continue to face considerable financial barriers. Copayments and other indirect costs not included in coverage reduce affordability, while wealthier groups benefit disproportionately through greater service utilization.
Malaysia also follows a dual-tiered system, integrating both public and private healthcare provision [43]. By 2019, around 97 % of the population had access to health coverage through either public or private schemes. However, this dual structure generates disparities in both quality and access. High-income households tend to prefer costlier private services, which are perceived as superior, while low-income groups rely on subsidized public facilities, which are often overburdened and variable in quality. Consequently, OOP spending is disproportionately concentrated among more affluent households.
3.3. Redistribution through Healthcare Financing
The redistributive effect of taxation (RE) is measured by comparing pre-tax and post-tax Gini coefficients. A positive RE value indicates a reduction in inequality, whereas a negative RE value reflects an increase in inequality.
3.3.1. Tax-financed systems
Tax-based systems have been shown to exert positive, pro-poor redistributive effects across twelve OECD countries, with progressive direct taxes compensating for the regressive nature of indirect taxation [6]. Consequently, such systems contribute to reducing income inequality. Notably, the pro-poor redistributive impact is greater in the United States (RE = 0.0059) compared with European tax-financed healthcare systems, such as those in Finland (RE = 0.0044) and the UK (RE = 0.0035) [6,45]. In the US, Medicaid was designed to target economically disadvantaged groups, while Finland and the UK operate universal systems providing access irrespective of income. Although universalism guarantees broad access, its redistributive impact is diluted compared to the targeted approach. With the implementation of the Affordable Care Act, disparities in regressivity may have diminished, though reliance on private insurance and OOPs continues to sustain considerable inequalities in the US [9,46,47].
In LMICs, direct taxation plays a central role in income redistribution, while the redistributive impact of indirect taxation varies by country. In Zambia, redistribution is pro-poor for both direct (RE = 0.0053) and indirect (RE = 0.0046) taxes, with taxation comprising 60.8 % of total health financing, thereby playing a pivotal redistributive role [19]. Direct taxes in Zambia are assessed on a per capita basis, ensuring contributions independent of household size. Similar positive redistributive outcomes from indirect taxation have been observed in Tanzania (RE = 0.07) and Ghana (RE = 0.01), supported by extensive VAT exemptions on agricultural products consumed largely by the poor, as well as progressive import duties [38,48]. In South Africa, taxes account for 38.2 % of healthcare financing. While direct taxes generate substantial pro-poor redistribution (RE = 0.0072), the redistributive effect of indirect taxes is negative (RE = −0.0025). Overall, the combined tax system remains pro-poor, with a net redistributive effect of RE = 0.0048 [16]. Similarly, in Argentina, direct taxation produced positive redistributive effects in both 1997 (RE = 0.2670) and 2002 (RE = 0.1870). The decline between these years reflects reduced progressivity, primarily driven by inflation expanding the taxpayer base. The contribution of the wealthiest decile dropped from 88.2 % of direct tax revenues in 1997 to 70.8 % in 2002. In contrast, indirect taxation deepened inequality, with negative redistributive effects recorded in 1997 (RE = −0.0920) and 2002 (RE = −0.1010) [26]. The regressive impact of indirect taxation largely reflects its non-discriminatory structure and differences in household consumption patterns.
3.3.2. Social Health Insurance
Bilger [49] provides the only available estimate of the redistributive impact of social health insurance, focusing on Switzerland. Public expenditure constitutes 15.2 % of total healthcare funding, while social health insurance generates a significant negative redistributive effect (RE = −0.0098), the largest among all core financing mechanisms. The increase in inequality results from the fact that insurance premiums are not linked to income, meaning that poorer households dedicate a greater proportion of their budget to premiums than wealthier households.
3.3.3. Private Healthcare Financing
The redistributive consequences of private financing have been widely documented in both HICs and LMICs, with OOPs consistently demonstrating a regressive effect as low-income households spend a higher share of their income on healthcare. Marked pro-rich redistribution has been observed in Switzerland (RE = −0.0124), Austria (RE = −0.0121), Palestine (RE = −0.037 in the West Bank; RE = −0.0247 in Gaza), Nigeria (RE = −0.0355), and Canada (RE = −0.2105) [[34], [49], [50], [51], [52]]. The financial strain of OOPs diminishes household resources for other welfare-enhancing consumption, disproportionately harming the poor.
The redistributive effect of private insurance depends largely on whether it is voluntary or mandatory, and on the extent of income-based coverage. In Italy, Portugal, and the UK, voluntary private insurance—which covers approximately 21 % of healthcare costs—is concentrated among higher-income groups, yielding a modest positive redistributive impact (RE = 0.001 to RE = 0.002).
In Switzerland, nearly universal coverage is achieved through mandatory basic insurance administered by private providers but regulated by the state. Premiums are determined by age, canton of residence, and deductible choice, rather than income [53]. While the flexibility of deductible choice allows individuals to lower premium costs, this mechanism introduces regressivity: wealthier individuals can more easily absorb higher deductibles, leading to a negative redistributive outcome (RE = −0.0124) [9,49]. For example, the poorest households may spend up to 5.5 % of their income on OOPs compared with only 2.1 % among the richest [56]. Supplemental voluntary insurance, such as coverage for private hospital rooms, further exacerbates inequality [53,57].
By contrast, the Dutch model incorporates a collective risk equalization mechanism that minimizes premium disparities and reduces the regressive effect of deductibles. Although wealthier individuals remain more likely to choose higher deductibles, the equalization system distributes financial risks more evenly across income groups [53,57]. Despite this, regressivity persists, as the affluent are better positioned to manage risks tied to high deductibles [56]. Meanwhile, France’s reliance on income-based social contributions reduces the redistributive burden of private insurance (RE = −0.002) [9,54]. Distinguishing between mandatory and voluntary insurance highlights key differences, with heavily regulated systems like those of Switzerland and the Netherlands functioning more akin to social health insurance [54].
In South Africa, private insurance improves income distribution (RE = 0.0103), with its redistributive impact exceeding that of total tax-based financing [16]. Private contributions account for nearly half of healthcare expenditure, reflecting the country’s high inequality (Gini index ∼0.70). Higher-income groups access faster, better-quality services through private insurance, while lower-income groups depend on overstretched public services. Consequently, complementary private insurance substantially supports healthcare financing in South Africa [24]. Similar dynamics are seen in Argentina, where private health insurance demonstrates a positive redistributive effect (RE = 0.0538) due to its high costs, which exclude poorer households from coverage [26].
-
Interpretation and Implications
This study underscores the central role of financing mechanisms in shaping redistributive outcomes and demonstrates how equitable financing can mitigate post-taxation income inequalities. Tax-based financing systems display the strongest progressivity, as direct taxation fosters redistribution toward low-income households and generally offsets the regressive effects of indirect taxation. As such, tax-financed systems often narrow income disparities.
Social insurance models—prevalent in many HICs and some MICs—are progressive in principle but can exhibit regressivity in practice, particularly due to ceilings on contributions and exemptions for high-income earners. These design features allow affluent taxpayers to benefit from social protection while contributing a smaller income share, thereby diminishing the system’s redistributive potential.
Private financing arrangements, including premiums and OOPs, are usually regressive. Flat-rate co-payments and non-income-based contributions impose disproportionate burdens on low-income households. Adjusting co-payments and mandatory contributions to reflect household income could reduce regressivity, thereby alleviating catastrophic expenditures for the poor and promoting equity in healthcare access [55].
An important issue for analysis is the variation in institutional arrangements across countries and the implications of these differences for interpretation. Health financing systems are situated within broader socio-economic and political contexts that shape both design and outcomes. The capacity of tax-based systems to reduce inequality depends on tax structures, collection efficiency, and the role of social transfers. Similarly, the equity impact of social insurance depends on contribution rules, including ceilings and exemptions. Private financing patterns—especially OOPs and co-payments—are influenced by regulatory frameworks, the scope of supplemental insurance, and cultural attitudes toward healthcare costs. In contexts with strong public provision, the reliance on private payments is limited, while in market-oriented systems, OOPs are a dominant determinant of access. Importantly, while equitable financing supports equitable access, the two are not synonymous: reforms addressing financing inequities are necessary but insufficient to guarantee equal service access. Policymakers must therefore situate equity strategies within country-specific institutional frameworks to ensure practical feasibility alongside theoretical soundness.
Although Kakwani indices are widely applied to evaluate financing equity, their limitations must be acknowledged [29]. A positive index indicates progressivity of payments relative to income but does not capture healthcare access. In LMICs, OOPs often appear progressive because wealthier households consume more healthcare services, while poorer households forgo care due to financial barriers. This “illusory” progressivity highlights the risk of misinterpretation: despite positive indices, OOPs can deepen inequalities by impoverishing vulnerable households. Progressivity measures must therefore be complemented by analyses of access and utilization to fully assess equity impacts.
This review further highlights the paucity of recent equity studies in HICs, where UHC has long been established. Research has increasingly focused on LMICs undergoing reforms or moving toward UHC. Nonetheless, analyses of vertical equity and redistributive effects remain highly relevant in high-income settings. UHC guarantees access without financial hardship but does not inherently ensure equity in financing or outcomes. Evaluating vertical equity clarifies whether higher-income groups contribute proportionally more, while redistributive analysis examines whether healthcare financing reduces income inequality overall. These insights are crucial for aligning health financing with broader equity objectives.
The lack of updated research in HICs is striking given the availability of extensive income and poverty databases such as Euromod and EU-SILC, which could support cross-country comparisons decades after the EU-funded ECuity project. Continued reliance on regressive financing mechanisms, such as flat co-payments or substantial OOPs, can disproportionately harm low-income households [56]. Policymakers should assess financing systems in terms of both vertical equity and redistributive effects to ensure that funding models not only sustain healthcare provision but also advance social justice by narrowing income disparities.
-
Concluding Remarks
The body of evidence indicates that equitable healthcare financing plays a pivotal role in lowering financial obstacles to healthcare access while simultaneously mitigating income inequalities. Health-related payments exert a significant impact on household economic well-being, particularly when OOPs undermine living standards and result in catastrophic expenditures.
Advancing towards equity requires the adoption of progressive financing structures alongside the continued expansion of UHC. Policy frameworks should prioritize alleviating financial barriers for low-income populations through carefully targeted subsidies, exemptions for essential health services, or the extension of insurance coverage to vulnerable groups. Designing healthcare systems to be both progressive and inclusive enables policymakers to tackle health inequities and economic disparities concurrently, thereby fostering fairer and more prosperous societies.
Acknowledgements
The authors wish to thank the Comparative Welfare State Data Project team for granting access to the dataset used in this analysis. They are also grateful to colleagues at the University of Edinburgh and University of Oslo for valuable feedback on earlier drafts.
Funding
This study did not receive any specific grant from funding agencies in the public, commercial, or not-for-profit sectors.
Conflict of Interest
The authors declare no conflicts of interest.
Author Contributions
E.M.C. led the study design, data analysis, and drafting of the manuscript. D.H.L. contributed to the comparative framework and critical interpretation of results. S.R.A. coordinated revisions, correspondence with the journal, and final manuscript preparation. All authors approved the submitted version.
References
[1] Anselmi L, Lagarde M, Hanson K. Equity in the allocation of public sector financial
resources in low- and middle-income countries: a systematic literature review. Heal
Policy Plan 2015;30(4):528–45.
[2] Asante A, Price J, Hayen A, Jan S, Wiseman V. Equity in health care financing in
low- and middle-income countries: a systematic review of evidence from studies
using benefit and financing incidence analyses. PLoS One 2016;11(4):e0152866.
[3] Lee I. Co-benefits from health and health systems to education. Heal Policy (New
York) 2024;142:105016.
[4] Pinna Pintor M, Fumagalli E, Suhrcke M. The impact of health on labour market
outcomes: a rapid systematic review. Heal Policy (New York) 2024;143:105057.
[5] O’Donnell O. Health and health system effects on poverty: a narrative review of
global evidence. Heal Policy (New York) 2024;142:105018.
[6] Wagstaff A, van Doorslaer E, van der Burg H, Calonge S, Christiansen T, Citoni G, Gerdtham U G, Gerfin M, Gross L, H¨akinnen U, Johnson P, John J, Klavus J,
Lachaud C, Lauritsen J, Leu R, Nolan B, Peran E, Pereira J, Propper C, Puffer F,
Rochaix L, Rodriguez M, Schellhorn M, Sundberg G, Winkelhake O. Equity in the
finance of health care: some further international comparisons. J Health Econ
1999;18(3):263–90.
[7] Wagstaff A, van Doorslaer E. Equity in the finance of health care: some
international comparisons. J Health Econ 1992;11(4):361–87.
[8] Wagstaff A, Van Doorslaer E. Progressivity, horizontal equity and reranking in
health care finance: a decomposition analysis for the Netherlands. J Health Econ
1997;16(5):499–516.
[9] Van Doorslaer E, Wagstaff A, Bleichrodt H, Calonge S, Gerdtham U G, Gerfin M,
Geurts J, Gross J, H¨
akkinen U, Leu R E, O’Donnell O, Propper C, Puffer F,
Rodríguez M, Sundberg G, Winkelhake O. The redistributive effect of health care
finance in twelve OECD countries. J Health Econ 1999;18(3):291–313.
[10] Van Doorslaer E, Wagstaff A, Bleichrodt H, Calonge S, Gerdtham U G, Gerfin M,
Geurts J, Gross L, Hakkinen ¨ U, Leu R E, O’Donnell O, Propper C, Puffer F,
Rodríguez M, Sundberg G, Winkelhake O. Income-related inequalities in health:
some international comparisons. J Health Econ 1997;16(1):93–112.
[11] Wagstaff A, van Doorslaer E, Paci P. On the measurement of horizontal inequity in
the delivery of health care. J Health Econ 1991;10(2):169–205. discussion 247-9,
251-6.
[12] Wagstaff A, van Doorslaer E. Equity in the finance of health care: some
international comparisons. J Health Econ 1992;11(4):361–87.
[13] Van Doorslaer E, O’Donnell O, Rannan-Eliya R, Somanathan A, Adhikari S, Garg C,
Harbianto D, Herrin A, M Nazmul Huq, Ibragimova A, Karan A, Lee T, Leung G,
Lu J, Ng C W, Pande B, Racelis R, Tao S, Tin K, Tisayaticom K, Trisnantoro L,
Vasavid C, Zhao X. Catastrophic payments for health care in Asia. Health Econ
2007:16.
[14] Van Doorslaer E, O’Donnell O, Rannan-Eliya R, Somanathan A, Adhikari S, Garg C,
Harbianto D, Herrin A, M Nazmul Huq, Ibragimova A, Karan A, Lee T, Leung G,
Lu J, Ng C W, Pande B, Racelis R, Tao S, Tin K, Tisayaticom K, Trisnantoro L,
Vasavid C, Zhao X. Effect of payments for health care on poverty estimates in 11
countries in Asia: an analysis of household survey data. The Lancet 2006:368.
[15] Makinen M, Waters H, Rauch M, Almagambetova N, Bitran R, Gilson L, McIntyre D,
Pannarunothai S, Prieto A L, Ubilla G, Ram S. Inequalities in health care use and
expenditures: empirical data from eight developing countries and countries in
transition. Bull World Health Organ 2000;78(1):55–65.
[16] Ataguba JE. The impact of financing health services on income inequality in an
unequal society: the case of South Africa. Appl Heal Econ Heal Policy 2021;19(5):
721–33.
[17] Gabani J, Mazumdar S, Hadji S, Amara M. The redistributive effect of the public health system: the case of Sierra Leone. Heal Policy Plan 2024;39(1):4–21.
[18] Molla AA, Chi C. Who pays for healthcare in Bangladesh? An analysis of
progressivity in health systems financing. Int J Equity Heal 2017;16(1).
[19] Mulenga A, Ataguba JE. Assessing income redistributive effect of health financing
in Zambia. Social Sci Med 2017;189:1–10.
[20] Wagstaff A, Van Doorslaer E, Paci P. Equity in the finance and delivery of health
care: some tentative cross-country comparisons. Oxf Rev Econ Policy 1989;5(1):
89–112.
[21] Aronson JR, Johnson P, Lambert PJ. Redistributive effect and unequal income tax
treatment. Eco J 1994;104(423):262–70.
[22] De Graeve D, Van Ourti T. The distributional impact of health financing in europe:
a review. World Econ 2003;26(10):1459–79.
[23] Kakwani NC. Measurement of tax progressivity: an international comparison. Eco J
1977;87(345):71–80.
[24] Ataguba JE, McIntyre D. Paying for and receiving benefits from health services in
South Africa: is the health system equitable? Heal Policy Plan 2012;27(1):i35–45.
Suppl.
[25] Nundoochan A. Improving equity in the distribution and financing of health
services in Mauritius, a small island state with deeply rooted welfare state
standards. BMJ Glob Health 2021;6(12).
[26] Cavagnero E, Bilger M. Equity during an economic crisis: financing of the argentine
health system. J Heal Econ 2010;29(4):479–88.
[27] Wagstaff A. Measuring equity in health care financing: reflections on (and
alternatives to) the world health organization’s fairness of financing index. The
World Bank; 1999. p. 2550. Policy Research Working Paper Series.
[28] Citoni G, De Matteis D, Giannoni M. Vertical equity in healthcare financing: a
progressivity analysis for the Italian regions. Heal Care (Don Mills) 2022;10:449.
[29] Cheng Q, Asante A, Susilo D, Satrya A, Man A, Fattah R, Haemmerli M, Kosen S,
Novitasari D, Puteri G, Adawiyah E, Hayen A, Gilson L, Mills A,
Tangcharoensathien V, Jan S, Thabrany H, Wiseman V. Equity of health financing
in Indonesia: a 5-year financing incidence analysis (2015-2019). Lancet Reg Health
– West Pac The 2022;21:100400.
[30] O’Donnell O, van Doorslaer E, Wagstaff A, Lindelow M. Analyzing health equity
using household survey data: a guide to techniques and their implementation.
World Bank Publications; 2007.
[31] Savedoff WD. Is there a case for social insurance? Heal Policy Plan 2004;19(3):
183–4.
[32] O’Donnell O, van Doorslaer D, Rannan-Eliya R, Somanathan A, Adhikari S,
Akkazieva B, Harbianto D, Garg C, Hanvoravongchai P, Herrin A, Huq M,
Ibragimova S, Karan A, Kwon S, Leung G, Lu J, Ohkusa Y, Pande B, Racelis R,
Tin K, Tisayaticom K, Trisnantoro L, Wan Q, Yang B, Zhao Y. Who pays for health
care in Asia? J Health Econ 2008;27(2):460–75.
[33] Chen M, Chen W, Zhao Y. New evidence on financing equity in China’s health care
reform–a case study on Gansu province, China. BMC Health Serv Res 2012;12:466.
[34] Abu-Zaineh M, Mataria A, Luchini S, Moatti J. Equity in Health Care Finance in
Palestine: the Triple Effects Revealed. J Health Econ 2009;28(6):1071–80.
[35] Abu-Zaineh M, Mataria A, Luchini S, Moatti J. Equity in health care financing in
Palestine: the value-added of the disaggregate approach. Soc Sci Med 2008;66(11):
2308–20.
[36] Smith PC. Universal health coverage and user charges. Health Econom Policy Law
2013;8(4):529–35.
[37] Wenzl M, Naci H, Mossialos E. Health policy in times of austerity—A conceptual
framework for evaluating effects of policy on efficiency and equity illustrated with
examples from Europe since 2008. Soc Sci Med 2017;187:127–34.
[38] Mills A, Ataguba J, Akazili J, Borghi J, Garshong B, Makawia S, Mtei G, Harris B,
Macha J, Meheus F, McIntyre D. Equity in financing and use of health care in
Ghana, South Africa, and Tanzania: implications for paths to universal coverage.
Lancet 2012;380(9837):126–33.
[39] Zweifel P. Building a competitive insurance system: switzerland’s strategy for
managed-care healthcare. Pharmacoeconomics 2006;24(2):111–9. Suppl.
[40] Baji P, Pavlova M, Gul´
acsi L, Groot W. Changes in equity in out-of-pocket payments
during the period of health care reforms: evidence from Hungary. Int J Equity
Health 2012;11:36.
[41] Law H D, Marasinghe D, Butler D, Welsh J, Lancsar E, Banks E, Biddle N, Korda R.
Progressivity of out-of-pocket costs under Australia’s universal health care system:
a national linked data study. Heal Policy (New York) 2023;127:44–50.
[42] Ntembe A, Tawah R, Faux E. Redistributive effects of health care out-of-pocket
payments in Cameroon. Int J Equity Health 2021;20(1).
[43] Baharin MFA, Juni MH, Manaf RAbdul. Equity in out-of-pocket payments for
healthcare services: evidence from Malaysia. Int J Environ Res Public Health 2022;
19(8).
[44] Mondaca ALN, Chi C. Equity in out-of-pocket payment in Chile. Rev Saude Publica
2017;51:44.
[45] Klavus J, Hakkinen ¨ U. Health care and income distribution in Finland. Heal Policy
(New York) 1996;38(1):31–43.
[46] Buettgens M, Blavin F, Pan C. The affordable care act reduced income inequality in
the US. Health Aff 2021;40(1):121–9.
[47] Cutler DM, Gruber J. The effect of Medicaid expansions on public insurance,
private insurance, and redistribution. American Eco Rev 1996;86(2):378–83.
[48] Akazili J, Welaga P, Bawah A, Achana F, Oduro A, Awoonor-Williams J,
Williams J, Aikins M, Phillips J. Is Ghana’s pro-poor health insurance scheme really
for the poor? evidence from Northern Ghana. BMC Health Serv Res 2014;14:637.
[49] Bilger M. Progressivity, horizontal inequality and reranking caused by health
system financing: a decomposition analysis for Switzerland. J Health Econ 2008;27
(6):1582–93.
[50] Sanwald A, Theurl E. Out-of-pocket payments in the Austrian healthcare system – A
distributional analysis. Int J Equity Health 2015;14(1).
[51] Zhong H. Extensions to decomposition of the redistributive effect of health care
finance. Health Econ 2009;18(10):1176–87.
[52] Oburota CS, Olaniyan O. Health care financing and income inequality in Nigeria.
Int J Soc Econ 2020;47(11):1419–31.
[53] Unger JP, De Paepe P. Commercial health care financing: the cause of U.S., Dutch,
and Swiss health systems inefficiency? Int J Health Serv 2019;49(3):431–56.
[54] Jusot F. Is the French health insurance an efficient instrument for intragenerational
income redistribution? J Med Econ 2004.
[55] Wagstaff A, Flores G, Hsu J, Smitz M, Chepynoga K, Buisman L, van Wilgenburg K,
Eozenou P. Progress on catastrophic health spending in 133 countries: a
retrospective observational study. Lancet Glob Health 2018;6(2):e169–79.
[56] Jusot F, Lemoine A. Do out‑of‑pockets undermine equity in healthcare financing? a
comparison of healthcare systems in Europe. Econ Stat 2024;542:57–78.
[57] Crivelli L, Salari P. The inequity of the Swiss health care system financing from a federal state perspective. Int J Equity Healt: 2014;13;17