Dr. Ayesha Khan¹, Dr. Samuel T. Ofori², Dr. Maria Delgado³, Dr. Liang Wu⁴
1 Department of Global Health, University of Nairobi, Kenya.
2 School of Public Health, University of Ghana, Accra, Ghana
* Corresponding Author: Dr. Ayesha Khan, Department of Global Health University of Nairobi P.O. Box 30197, Nairobi, Kenya; Email: [email protected]
Abstract
Despite the unprecedented speed of COVID-19 vaccine development, a significant proportion of low-income (LIC) and lower-middle-income countries (LMIC) failed to reach even 10% population coverage during early vaccine deployment phases. Nearly three years into the pandemic, a comprehensive evaluation of the consequences stemming from delayed vaccine availability remains critical. This study aimed to investigate whether delayed initiation of COVID-19 vaccination campaigns was linked to increased cumulative infection rates and deaths, particularly in relation to countries’ economic capacities. Employing an ecological study design, we analysed national-level data on first vaccination dates and corresponding cumulative case and mortality burdens. Economic status was assessed via World Bank income classifications, per capita gross domestic product adjusted for purchasing power parity (GDP PPP), and total GDP PPP. Countries with smaller economies experienced significantly longer delays—up to 100 days—before initiating vaccinations. Among LICs, each additional day of delay in vaccination start was associated with a 1.92% rise in cumulative COVID-19 cases compared to high-income countries (95% CI: 0.100–3.87; p = 0.0395), controlling for population size, median age, and testing data availability. Similarly, countries in the lowest GDP PPP bracket faced a 2.73% increase in cumulative cases per day of delay (95% CI: 0.100–5.44; p = 0.0415). While mortality followed a similar trend, these findings were not statistically significant. Our findings suggest that delayed vaccine access disproportionately impacted nations with weaker economies, underscoring the need for equitable global vaccine distribution in future pandemics.
Keywords: COVID-19, vaccine equity, LMICs, global health, immunisation (vaccination).
© The Author(s) 2025. Open Access This article is licensed under a Creative Commons Attribution-NonCommercial-NoDerivatives 4.0 International License, which permits any non-commercial use, sharing, distribution and reproduction in any medium or format, as long as you give appropriate credit to the original author(s) and the source, provide a link to the Creative Commons licence, and indicate if you modified the licensed material. You do not have permission under this licence to share adapted material derived from this article or parts of it. The images or other third-party material in this article are included in the article’s Creative Commons licence, unless indicated otherwise in a credit line to the material. If material is not included in the article’s Creative Commons licence and your intended use is not permitted by statutory regulation or exceeds the permitted use, you will need to obtain permission directly from the copyright holder. To view a copy of this licence, visit https://creativecommons.org/licenses/by-nc-nd/4.0/
1. Introduction
The rapid advancement in the development, testing, and global distribution of coronavirus disease 2019 (COVID-19) vaccines has played a critical role in decreasing disease-related illness and death on a global scale. Within the first year of vaccine deployment, it is estimated that COVID-19 vaccines prevented approximately 14.4 million deaths worldwide [1]. Although this achievement underscores the significant impact of vaccination in controlling the pandemic, glaring disparities in vaccine access, distribution, and uptake persist across nations [1-5]. Despite the proven efficacy of COVID-19 vaccines in reducing severe illness, by October 2022, just a quarter of individuals in low-income countries had received at least one vaccine dose [6]. This figure is starkly contrasted by data from high-income countries (HICs), where around 72% of the population had been administered at least one dose [6]. Nations with the lowest gross domestic product (GDP) rankings were especially delayed in launching vaccination campaigns.
Many low- and lower-middle-income countries (LMICs) failed to achieve even 10% vaccine coverage during the early months of vaccine distribution in spring 2021 [7]. These delays, primarily resulting from global inequalities and access-related challenges, [7] pose serious threats to public health within economically disadvantaged nations. In the initial stages of the pandemic, considerable emphasis was placed on understanding how the virus was affecting countries with the fewest resources. LICs and LMICs have long borne the weight of higher incidences of infectious diseases such as HIV/AIDS and tuberculosis compared to the global average [8]. Compounding the issue is their limited healthcare infrastructure, often characterised by a significantly lower number of hospital and intensive care unit beds than that of HICs [8]. Although early data indicated that HICs reported more confirmed COVID-19 cases and deaths, this trend was likely influenced by broader testing capacities and better surveillance systems.
In contrast, limited testing availability in LICs and LMICs resulted in underreporting of COVID-19 fatalities. Excess mortality—considered a more accurate measure of the pandemic’s toll—has been shown to be higher per capita in LICs and LMICs than in HICs [9]. Additionally, a large portion of deaths in low-income regions occurs in rural areas, where fatalities are frequently excluded from official statistics [10]. Beyond health outcomes, the economic fallout of the pandemic has been particularly severe for LICs and LMICs. During the second quarter of 2020, working hour losses were estimated at 13.4% for LICs and a striking 29% for LMICs—compared to 15.8% for HICs [11]. By mid-2021, inflationary pressures were already escalating in low-income economies and were subsequently exacerbated by geopolitical events such as the Russian invasion of Ukraine, which triggered significant increases in food prices and supply disruptions in already fragile economies [12].
A strong correlation has been established between national vaccination rates and the financial burden experienced by individuals. In countries with the lowest vaccination coverage, people were more likely to report severe financial strain. In fact, the likelihood of experiencing economic hardship in LICs was 16.88 times higher (95% CI: 14.69–19.39) than in HICs [13]. Employment structures further deepen these inequities. In LICs, a higher proportion of the workforce relies on informal employment that necessitates in-person interaction and mobility. Conversely, workers in HICs and upper-middle-income countries (UMICs) often had the option to transition to remote work. Furthermore, patterns of interpersonal contact during the pandemic varied significantly across countries. In HICs and UMICs, older adults had reduced contact with younger age groups, while in LICs and LMICs, such age-specific contact reductions were not observed—leaving vulnerable populations more exposed [14]. Lockdown policies and public health interventions also had unequal effects.
Whereas HICs and UMICs could buffer the impact of restrictions through stable economic systems, government relief packages, and resilient healthcare systems, LICs and LMICs lacked similar institutional support mechanisms [15]. As of late 2022, many low-income countries had yet to surpass 20% vaccine coverage for the primary vaccination series, with even lower figures for booster doses [16]. Particularly concerning is that only about 37% of healthcare workers in these countries had completed a full primary vaccination regimen [17]. Despite the launch of the COVID-19 Vaccines Global Access (COVAX) initiative in April 2020, intended to support equitable vaccine distribution, major economic blocs such as the United States and European Union fell short—donating less than half of the vaccines they had pledged [18]. Alarmingly, during a June 2022 COVAX allocation session, reports indicated that around 182 million unused vaccine doses were scheduled for destruction by the US and EU [19].
Economic and political factors have been instrumental in shaping public health responses during the pandemic [20-23]. Smaller economies often lacked the financial means to procure vaccines or were offered unfavorable terms. For instance, countries such as Uganda and South Africa paid $7.00 and $5.25 per dose, respectively—substantially more than certain European countries, where the cost per dose was as low as $3.50 [23]. Efforts by some LICs and LMICs to invoke the Trade-Related Aspects of Intellectual Property Rights (TRIPS) waiver to bypass intellectual property protections and improve vaccine accessibility were ultimately denied by the G7. These early negotiations, coupled with issues surrounding purchasing power and IP protections, drove up the cost of vaccines for poorer nations. As a result, vaccine donations from wealthier nations were seen as vital—but the inconsistent follow-through on donation promises has greatly limited their impact. Compounding this are ongoing challenges in testing, contact tracing, and access to essential healthcare services in LMICs.
Given the clear disparities in vaccine access and the subsequent health and economic implications, this study aimed to: (1) measure the time each country took to begin administering COVID-19 vaccines; (2) assess whether time to initial vaccination correlated with economic standing; and (3) evaluate whether the delay in vaccine rollout was associated with increased COVID-19 case and mortality rates. Our core hypothesis was that nations with the lowest economic strength would face longer delays in accessing vaccines and would, as a result, suffer disproportionately higher adverse outcomes related to COVID-19.
2. Methodology
2.1 Study Framework and Data Sources
This investigation employed an ecological study design to explore variations in COVID-19 vaccine access timelines and their association with pandemic-related outcomes. The unit of analysis was each individual country. All relevant data were drawn from open-access repositories (see Appendix 1 for full sources). In particular, data were sourced from the World Health Organisation (WHO) COVID-19 Dashboard and the Our World in Data platform [24]. All datasets were extracted between July and October 2022.
2.2 Measurement of COVID-19 Case Numbers and Mortality
Figures for cumulative COVID-19 infections and fatalities were retrieved directly from official WHO reports. We calculated total case and death counts from the beginning of the global pandemic through to 31 May 2021. Although an extended timeframe was considered, this cut-off was selected to reduce the confounding effects introduced by the emergence of the Delta variant of concern (VOC), which began circulating widely shortly thereafter [25-26].
2.3 Estimating Time to Vaccine Introduction
The variable ‘time to first vaccination’ was computed as the number of days between the global index COVID-19 case (31 December 2019) and the date of the first vaccine administered in each country, as reported by WHO. To assess disparities in timing, we compared vaccine rollout lags across different economic strata using either one-way analysis of variance (ANOVA) or Pearson correlation coefficients, depending on data distribution.
2.4 Economic Influence on Vaccine Access and Outcomes
In the hypothesised causal framework (Appendix 2-3), economic classification was treated as a potential effect modifier in the relationship between vaccination timing and COVID-19 case and death rates. We posited that countries with more limited economic capacity—specifically, low- and lower-middle-income nations—would experience delayed vaccine access, potentially resulting in worse pandemic outcomes. This effect modification was examined using three distinct approaches:
- Income Brackets: Countries were categorised based on the World Bank’s 2021 income classifications—low-income, lower-middle-income, upper-middle-income, and high-income.
- GDP per Capita (Log-Transformed and Binned): Nations were grouped into five bands based on log-transformed GDP purchasing power parity (PPP) per capita values: <7.47, 7.78–8.48, 8.49–9.47, 9.48–10.46, and >10.46.
- Crude GDP (Log-Transformed): Here, GDP was treated as a continuous variable after log transformation.
Each economic categorisation was used separately to model its interaction with cumulative case numbers and mortality.
2.5 Identification and Adjustment for Confounding Variables
To accurately assess the relationship between vaccine timing and COVID-19 outcomes, several potential confounders were reviewed. These included population size, testing availability, case counts, the COVID-19 stringency index, and median age (Appendix 2). However, the stringency index was excluded from the final model as it did not materially influence the results. Testing rates were originally operationalised as tests per capita, but extensive missing data complicated analysis. Notably, the likelihood of absent testing data was significantly higher among low-income nations—9.917 times greater (95% CI: 3.202–30.711) than for high-income countries (p < 0.0001). A similar pattern was observed when comparing countries in the lowest GDP group to those in the highest GDP group, with an odds ratio of 15.862 (95% CI: 3.214–78.288; p = 0.0007). Moreover, countries lacking test data differed by −2.144 units (95% CI: −3.095 to −1.194) in mean GDP PPP compared to those with available data (p < 0.0001).
To avoid restricting the dataset to only countries with full testing data, test data availability was dichotomised (yes/no) and used as a proxy for data reliability. Models were developed both with and without testing data as a covariate. For clarity, this manuscript presents the results from the model excluding testing availability, while those including it are provided in Appendix 3. Population size, due to its extreme right skew, was log-transformed to improve its linearity with both outcome variables. For models predicting COVID-19-related mortality, we considered additional variables: the proportion of the population aged 65 or older, the proportion aged 75 or older, cardiovascular mortality rates, hospital bed capacity per capita, and life expectancy (see Appendix 2). However, these factors were not found to have significant explanatory power in the models and were excluded, resulting in consistent covariate sets for both mortality and case models.
2.6 Analytical Approach
To evaluate the effect of vaccine rollout timing on cumulative COVID-19 cases and deaths, we employed multiple linear regression. The primary estimates—including beta coefficients, 95% confidence intervals, and model fit indicators—were generated using ordinary least squares (OLS) regression. Categorical predictors and interaction effects were dummy coded appropriately to preserve statistical validity. To ensure model robustness and offer additional goodness-of-fit metrics, we re-estimated the same models using a generalised linear model (GLM) framework. This allowed for the calculation of Akaike Information Criterion (AIC) and Bayesian Information Criterion (BIC) scores for model comparison. All statistical modeling and diagnostics were performed using SAS software (version 9.4; SAS Institute). Data visualisation, including plots of interactions between categorical and continuous variables, were created using the emmeans package in R (version 4.0.03; R Foundation).
3. Result
3.1 Timing of Initial Vaccine Administration
We examined the interval between the globally first confirmed COVID-19 case (31 December 2019) and the date of each country’s first reported vaccine administration. This lag was analysed using three separate economic indicators: World Bank income classifications (Figure 1A), log-transformed GDP per capita adjusted for purchasing power parity (GDP PPP) (Figure 1B), and overall log-transformed crude GDP PPP (Figure 1C). Across all metrics, low-income nations experienced significantly longer delays in launching vaccine programs compared to high-income countries. Specifically, countries designated as low-income had an average delay of 89.533 days (95% CI: 50.829 to 128.238) relative to high-income nations (p < 0.0001) (see Appendix 4). Likewise, those in the lowest GDP PPP category experienced a 100.034-day delay on average (95% CI: 50.058 to 150.01) compared to those in the highest GDP PPP category (p < 0.0001) (Appendix 5).
As income levels and economic capacity increased—whether measured by GDP per capita or overall GDP PPP—the average time to first vaccine rollout decreased accordingly (Figures 1B, 1C; Appendix 4-5). When GDP PPP was treated as a continuous variable, a moderate inverse correlation was identified between economic size and vaccination delay (R² = 0.47723, p < 0.0001), indicating that wealthier countries were generally quicker in administering their first vaccine. A global map illustrating the country-level variation in days until the first vaccination further highlights the stark disparities, with lighter-shaded regions denoting longer delays (Figure 1D).
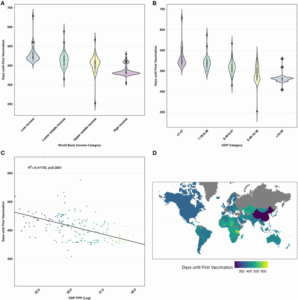
Figure 1:
(A) Comparison of days until the first vaccine administration by World Bank income group.
(B) Days to first vaccine by GDP PPP per capita (log-transformed, categorical).
(C) Relationship between days to first vaccine and crude GDP PPP (log-transformed).
(D) Choropleth map indicating time to first vaccine rollout across countries; lighter shades reflect longer delays.
3.2 Relationship Between Vaccination Delay and COVID-19 Outcomes
3.2.1 Cumulative Confirmed Cases
We applied multiple linear regression to evaluate how delays in vaccine rollout impacted the total number of confirmed COVID-19 cases. The outcome variable was the log-transformed cumulative case count for each country from the beginning of the pandemic through 31 May 2021. Delayed access was measured in days from the global index case to each country’s first reported vaccine. Interaction terms were incorporated to evaluate the modifying effect of economic status (using World Bank classification, GDP PPP per capita category, and crude GDP PPP). Additional covariates—median age, 2021 log-transformed population, and testing data availability—were adjusted for in all full models. Controlling for these factors, we found that in low-income countries, each one-day delay in starting vaccination was associated with a 1.92% increase in cumulative cases compared to high-income countries (95% CI: 0.100 to 3.87, p = 0.0395). In lower-middle-income countries, the same delay corresponded to a 1.11% increase (95% CI: −0.70 to 2.94), though this was not statistically significant (p = 0.2351).
Notably, upper-middle-income countries showed a 3.46% increase per day of delay (95% CI: 1.71 to 5.23, p = 0.0001). Similar trends emerged using GDP-based metrics. For instance, in countries within the lowest GDP PPP category, each additional day of delay was associated with a 2.73% increase in cumulative cases relative to countries in the highest GDP category (95% CI: 0.100 to 5.44, p = 0.0415). Treating GDP PPP as a continuous variable, the interaction with days-to-vaccine was significant (p = 0.0377), suggesting that economic scale moderates the relationship between vaccination timing and case burden. Table 1 summarises these associations, including both crude and adjusted models with and without interaction terms.
Table 1: Interaction Between Economic Classification And Delay In Vaccine Rollout On Cumulative Case Counts
| Parameter | Crude Modelβ (95% CI) | P-value | Full Model Without Interaction*β (95% CI) | P-value | Full Model With Interaction*β (95% CI) | P-value |
| I. World Bank Income Classifications | ||||||
| Days to vaccine | −0.022 (−0.029, −0.015) | <0.0001 | −0.006 (−0.012, 0) | 0.0631 | −0.026 (−0.04, −0.012) | 0.0005 |
| Income classification: Low income | — | — | −0.871 (−2.226, 0.484) | 0.2062 | −8.275 (−16.038, −0.511) | 0.0369 |
| Lower-middle income | — | — | −0.186 (−1.168, 0.796) | 0.7087 | −3.905 (−11.022, 3.212) | 0.2801 |
| Upper-middle income | — | — | 0.483 (−0.256, 1.222) | 0.1989 | −12.787 (−19.402, −6.172) | 0.0002 |
| High income (Reference) | — | — | — | — | — | — |
| Days to vaccine × Low income | — | — | — | — | 0.019 (0.001, 0.038) | 0.0395 |
| Days to vaccine × Lower-middle income | — | — | — | — | 0.011 (−0.007, 0.029) | 0.2351 |
| Days to vaccine × Upper-middle income | — | — | — | — | 0.034 (0.017, 0.051) | 0.0001 |
| Days to vaccine × High income (Reference) | — | — | — | — | — | — |
| II. GDP PPP (Log-Transformed) | ||||||
| Days to vaccine | — | — | −0.006 (−0.012, 0.001) | 0.091 | −0.065 (−0.121, −0.009) | 0.0239 |
| GDP PPP | — | — | 0.308 (−0.135, 0.751) | 0.1714 | −0.672 (−1.695, 0.351) | 0.1962 |
| Days to vaccine × GDP PPP | — | — | — | — | 0.002 (0, 0.004) | 0.0377 |
| III. GDP PPP Per Capita (Log-Transformed, Categorised) | ||||||
| Days to vaccine | — | — | −0.007 (−0.013, 0) | 0.0464 | −0.033 (−0.056, −0.01) | 0.0048 |
| GDP < 7.47 | — | — | −0.270 (−1.648, 1.107) | 0.6991 | −10.103 (−20.287, 0.082) | 0.0518 |
| GDP 7.78–8.48 | — | — | 0.393 (−0.802, 1.587) | 0.517 | −0.035 (−10.884, 10.814) | 0.995 |
| GDP 8.49–9.47 | — | — | 0.699 (−0.232, 1.629) | 0.140 | −11.037 (−20.924, −1.150) | 0.0289 |
| GDP 9.48–10.46 | — | — | 0.599 (−0.190, 1.388) | 0.136 | −12.679 (−21.794, −3.565) | 0.0067 |
| GDP > 10.46 (Reference) | — | — | — | — | — | — |
| Days to vaccine × GDP < 7.73 | — | — | — | — | 0.027 (0.001, 0.053) | 0.0415 |
| Days to vaccine × GDP 7.74–8.97 | — | — | — | — | 0.005 (−0.022, 0.033) | 0.7045 |
| Days to vaccine × GDP 8.98–10.21 | — | — | — | — | 0.031 (0.005, 0.057) | 0.0181 |
| Days to vaccine × GDP 9.48–10.46 | — | — | — | — | 0.036 (0.011, 0.060) | 0.0046 |
| Days to vaccine × GDP > 10.21 (Reference) | — | — | — | — | — | — |
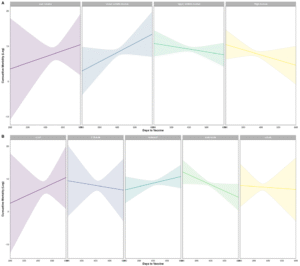
Predicted log-case values were visualised in a contour plot (Figure 2). Countries initiating vaccinations within 350 days displayed distinct patterns based on economic status. Among the poorest economies, earlier vaccination corresponded to higher predicted case counts, while in wealthier countries, delayed vaccination appeared to align with elevated cumulative cases. In GDP PPP-stratified models, countries in the lowest economic bracket showed increasing cumulative cases as vaccine delays grew (Figure 3A), while countries in the highest bracket exhibited the opposite trend. The pattern was also observed in models stratified by World Bank income group (Figure 3B). Low- and lower-middle-income countries demonstrated rising predicted log-case counts with increasing delays, whereas upper-middle- and high-income countries showed declining trends.
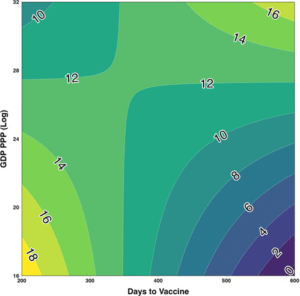
Figure 2: Contour plot showing interaction between log-GDP PPP and vaccination delay on estimated log-cumulative cases. Adjusted for population size (2021), median age, and testing data availability.
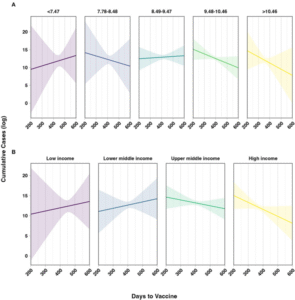
Figure 3: Interaction plots showing predicted log-cumulative cases by:
(A) GDP PPP per capita categories, and
(B) World Bank income group.
All models adjusted for 2021 population, testing availability, and median age. Shaded areas represent 95% prediction intervals.
3.2.2 Cumulative Mortality
The relationship between delayed vaccine access and total COVID-19 deaths was also assessed using linear regression, adjusting for the same set of confounding variables (see Supplementary Table 5). In contrast to the case models, the modification effect of economic classification was less pronounced in mortality models and did not reach statistical significance across most strata. However, the direction and scale of effects closely mirrored those observed for cumulative cases. Among low-, lower-middle-, and upper-middle-income countries, each additional day of vaccine delay was associated with a proportional rise in cumulative mortality. Likewise, countries in the lowest GDP PPP group exhibited increases in death counts with each day of delay when compared to those in the highest GDP PPP bracket. When GDP PPP was included as a continuous interaction term, delayed vaccine access continued to predict increases in mortality.
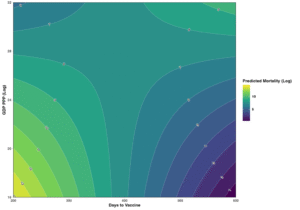
Predicted trends for cumulative deaths were plotted (Appendix 7). Although the confidence intervals were wider—owing to fewer significant effects—similar interaction dynamics were seen. Countries with smaller economies tended to show upward trends in predicted mortality with increasing vaccine delays, while wealthier nations saw flatter or even negative slopes in these models. Appendix 8 further visualises the two-way interactions for cumulative mortality by both economic classification systems. Though statistically weaker, these patterns echoed the findings in the cumulative case analyses, reinforcing the broader implication: economically disadvantaged countries that experienced longer delays in vaccine rollout faced heightened COVID-19 burdens.
4. Discussion
This ecological analysis explored the relationship between delayed access to COVID-19 vaccination and country-level outcomes—specifically cumulative cases and mortality—while considering the modifying effect of economic classification. Our findings reveal that nations categorised as low-income or those with the lowest gross domestic product (GDP) or purchasing power parity (PPP) per capita tended to experience significantly worse COVID-19 outcomes when contrasted with high-income or economically stronger countries. Although initial unadjusted correlations suggested a paradoxical trend—where countries with the longest wait for vaccines reported fewer cases and deaths—this observation was reversed after controlling for relevant confounding factors and incorporating economic effect modifiers. These results emphasise the importance of factoring in economic capacity when interpreting pandemic outcomes and underscore the need to ensure timely, fair, and sufficient vaccine access for countries with limited financial and logistical capacity [27-28].
Timely vaccine distribution plays a critical role in mitigating the public health impact of rapidly spreading infectious diseases. While the World Health Organisation (WHO) initially recommended equitable global vaccine distribution following regulatory approvals [29], our findings show that wealthier nations not only received vaccines sooner but also did so with less variability in timing. By contrast, low-income countries (LICs) experienced the most prolonged delays, with a much wider spread in rollout timelines. Earlier modeling and allocation frameworks, which prioritised vaccine distribution based on age demographics and disease burden [29-31], may have inadvertently favored countries with older populations—typically high-income countries (HICs). Given that LICs and lower-middle-income countries (LMICs) tend to have younger populations [32], these strategies may have contributed to inequitable vaccine access, even if unintentionally.
One often-cited reason for the inequitable global distribution of COVID-19 vaccines is vaccine hesitancy in LMICs. However, empirical evidence contradicts this justification. A multi-country study by Arce et al. demonstrated that willingness to receive COVID-19 vaccines was notably higher in LMICs—averaging 80.3%—compared to just 64.6% in the United States and 30.4% in Russia [33]. Respondents in LMICs also expressed greater trust in the vaccines’ safety and efficacy than their counterparts in several HICs. Multiple other studies support this conclusion, showing consistently high willingness to vaccinate across LMICs despite persistent access barriers [22-34-35-36-39]. This raises significant ethical and public health concerns. The combination of high demand and low access undermines the moral justification for vaccine nationalism and highlights the global failure to translate equity principles into practice. Further mixed-methods research is warranted to explore how prolonged inequities may have influenced trust in health systems or diminished future vaccine uptake, particularly in previously willing populations.
Despite this high level of willingness, vaccination coverage in LMICs remains suboptimal, resulting in uneven protection and poorer health outcomes. For instance, the number of deaths averted per 10,000 vaccine doses was markedly lower in LICs (26.23) compared to HICs (46.14), largely due to lower vaccination coverage [4]. Our study reinforces this disparity by demonstrating that LICs experienced the most significant delays in vaccine rollout, which were statistically associated with increases in cumulative COVID-19 cases. Specifically, every additional day of delay was linked to a 1.1% increase in case counts in LICs. Although upper-middle-income countries (UMICs) exhibited an even larger increase in case counts per day of delay, they experienced substantially shorter delays on average. These findings suggest that the temporal gap in vaccine rollout contributed to a greater disease burden in economically disadvantaged countries during the pandemic’s early waves.
Furthermore, sustained transmission in largely unvaccinated populations increases the risk of new variant emergence [40]. Our analysis indicates that delayed vaccine access in LICs, LMICs, and UMICs was consistently associated with rising cumulative case counts, suggesting ongoing and potentially expanding local epidemics. Supporting this, a separate metapopulation modeling study showed that pronounced inequities in vaccine distribution could lead to earlier and larger global peaks [40]. Equitable vaccine sharing could rapidly reduce the pool of susceptible individuals, thereby curbing viral spread and lowering the probability of variant emergence—benefiting global health security as a whole.
To the best of our knowledge, this is among the first empirical investigations to assess country-level economic indicators and their influence on real-world COVID-19 outcomes using comprehensive data. Prior work has largely relied on simulation models that, while informative, are constrained by assumptions and limited by parameter uncertainty. Our study adds needed real-world context, providing a robust and grounded picture of the pandemic’s unequal impact across the economic spectrum. By focusing on vaccine rollout timing and its interaction with national economic status, this work offers critical insights into structural determinants of pandemic inequity.
Though ecological studies cannot draw causal conclusions at the individual level, this design is suitable for exploring relationships at the country level—particularly for a global health crisis such as COVID-19, where responses were largely determined by national capacity and policies. Nonetheless, important within-country disparities may not be captured in aggregate analyses. Regional or subnational variations in vaccine access—especially among marginalised populations—remain a critical blind spot. Future studies should strive to obtain and analyse disaggregated data to understand internal inequalities and support targeted public health interventions.
Data quality also posed limitations to our study. Several countries, particularly those with the lowest economic capacity, had missing or incomplete testing and mortality data. As with other research in this domain, our findings are constrained by the accuracy and consistency of national reporting systems. Variation in testing protocols, healthcare access, death attribution, and vaccine delivery strategies across countries further complicates global comparisons.4 These limitations reflect systemic weaknesses in data infrastructure, especially in LICs, and point to an urgent need for international investment in global health information systems. Real-time, reliable, and disaggregated data are foundational to equitable pandemic response, enabling better resource allocation, prioritisation, and accountability.
In conclusion, our study highlights how economic inequality has translated into health inequality during the COVID-19 pandemic. The timing of vaccine access was significantly influenced by economic capacity, and delays in access among LICs and LMICs were associated with higher COVID-19 case counts. These delays, in turn, limited the benefits of vaccination in countries that needed them the most. International mechanisms such as COVAX must go beyond symbolic pledges and be supported by enforceable commitments, logistical support, and transparent accountability. Achieving health equity in global vaccination campaigns requires more than goodwill—it demands structural reform, financial solidarity, and a genuine commitment to global justice.
-
Conclusion
This study identified an average delay of approximately 100 days in the administration of the first COVID-19 vaccine in low-income countries compared to high-income nations. These delays were significantly associated with higher cumulative COVID-19 case counts among low-income countries. Had equitable vaccine allocation and strategies to enhance vaccine uptake been implemented early in the pandemic, it is plausible that many of these cases—and the resulting deaths—could have been prevented. Reliable estimation of outcomes such as cumulative cases and excess mortality is crucial for informing public health strategies, evaluating disparities in disease burden, and identifying systemic and infrastructural needs to support fair and effective resource allocation. Moreover, the use of real-world data strengthens the accuracy of these findings, offering valuable insight into the true consequences of delayed vaccine access. These results contribute to critical global policy discussions, underscoring the need for allocation frameworks that prioritise health equity rather than economic advantage. The findings from this study highlight the necessity of ensuring timely vaccine access for all countries, particularly during future pandemics when new variants may arise with differing transmissibility, severity, or immune evasion. Future research should investigate how delayed vaccine rollouts influenced the trajectory of viral spread across countries, particularly during periods of rapid case growth. Additionally, the role of misinformation and disinformation in shaping vaccine hesitancy warrants closer examination. Understanding and addressing these dynamics is essential to improving pandemic preparedness and response, and to building public trust in vaccination programmes worldwide.
References
[1] Polack FP, Thomas SJ, Kitchin N, Absalon J, Gurtman A, Lockhart S, et al. Safety and efficacy of the BNT162b2 mRNA COVID-19 vaccine. N Engl J Med. (2020) 383:2603–15. 10.1056/NEJMoa2034577
[2] Rouw A, Wexler A, Kates J, Michaud J. Global COVID-19 Vaccine Access: A Snapshot of Inequality. KFF Coronavirus (COVID-19) (2021). Available online at: https://www.kff.org/policy-watch/global-covid-19-vaccine-access-snapshot-of-inequality/ (accessed November 1, 2022).
[3] Schaffer DeRoo S, Pudalov NJ, Fu LY. Planning for a COVID-19 vaccination program. JAMA. (2020) 323:2458–9. 10.1001/jama.2020.8711
[4] Watson OJ, Barnsley G, Toor J, Hogan AB, Winskill P, Ghani AC. Global impact of the first year of COVID-19 vaccination: a mathematical modelling study. Lancet Infect Dis. (2022) 22:1293–302. 10.1016/S1473-3099(22)00320-6
[5] World Health Organisation. Achieving 70% COVID-19 Immunisation Coverage by Mid-2022 (2021). Available online at: https://www.who.int/news/item/23-12-2021-achieving-70-covid-19-immunisation-coverage-by-mid-2022 (accessed October 15, 2022).
[6] United Nations Development Programme (UNDP). Global Dashboard for Vaccine Equity. UNDP Data Futures Platform. Available online at: https://data.undp.org/vaccine-equity/ (accessed November 1, 2022).
[7] Mathieu E, Ritchie H, Ortiz-Ospina E, Roser M, Hasell J, Appel C, et al. A global database of COVID-19 vaccinations. Nat Hum Behav. (2021) 5:947–53. 10.1038/s41562-021-01122-8
[8] Walker PGT, Whittaker C, Watson OJ, Baguelin M, Winskill P, Hamlet A, et al. The impact of COVID-19 and strategies for mitigation and suppression in low- and middle-income countries. Science. (2020) 369:413–22. 10.1126/science.abc0035
[9] Oxfam Pandemic of Greed: A Wake-Up Call for Vaccine Equity at a Grim Milestone. Oxfam International (2022). Available online at: https://www.oxfam.org/en/research/pandemic-greed (accessed December 5, 2022).
[10] Gyawali N, Al-Amin HM. Living and dying with COVID-19 in South Asian low- and middle-income countries. Front Public Health. (2021) 9: 600878. 10.3389/fpubh.2021.600878
[11] International Labour Organisation. ILO Monitor: COVID-19 and the World of Work. Seventh Edition Updated Estimates and Analysis. (2021). Available online at: https://www.ilo.org/wcmsp5/groups/public/@dgreports/@dcomm/documents/briefingnote/wcms_767028.pdf (accessed December 5, 2022).
[12] World Bank Global Economic Prospects. Washington, DC: World Bank €; (2022). Available online at: https://openknowledge.worldbank.org/handle/10986/37224 (accessed December 5, 2022).
[13] Khetan AK, Yusuf S, Lopez-Jaramillo P, Szuba A, Orlandini A, Mat-Nasir N, et al. Variations in the financial impact of the COVID-19 pandemic across 5 continents: a cross-sectional, individual level analysis. EClinicalMedicine. (2022) 44:101284. 10.1016/j.eclinm.2022.101284
[14] Mousa A, Winskill P, Watson OJ, Ratmann O, Monod M, Ajelli M, et al. Social contact patterns and implications for infectious disease transmission – a systematic review and meta-analysis of contact surveys. Elife. (2021) 10:e70294. 10.7554/eLife.70294.sa2
[15] Panneer S, Kantamaneni K, Akkayasamy VS, Susairaj AX, Panda PK, Acharya SS, et al. The great lockdown in the wake of COVID-19 and its implications: lessons for low and middle-income countries. Int J Environ Res Public Health. (2022) 19:610. 10.3390/ijerph19010610
[16] WHO Coronavirus (COVID-19) Dashboard. Available online at: https://covid19.who.int (accessed November 1, 2022).
[17] World Health Organisation. Vaccine equity. https://www.who.int/campaigns/vaccine-equity [Accessed November 1, 2022]
[18] COVID-19 Vaccine Doses Donated to COVAX. Our World in Data. Available online at: https://ourworldindata.org/grapher/covax-donations (accessed November 1, 2022).
[19] World Health Organisation. Report of the Independent Allocation of Vaccines Group on the Allocation of COVAX Facility Secured Vaccines (2022). Available online at: https://www.who.int/publications/m/item/report-of-the-independent-allocation-of-vaccines-group-on-round-16-review-meeting−7-june-2022 (accessed November 1, 2022).
[20] Mena GE, Martinez PP, Mahmud AS, Marquet PA, Buckee CO, Santillana M. Socioeconomic status determines COVID-19 incidence and related mortality in Santiago, Chile. Science. (2021) 372:eabg5298. 10.1126/science.abg5298
[21] Pak A, Adegboye OA, Adekunle AI, Rahman KM, McBryde ES, Eisen DP. Economic consequences of the COVID-19 outbreak: the need for epidemic preparedness. Front Public Health. (2020) 8:241. 10.3389/fpubh.2020.00241
[22] Mobarak AM, Miguel E, Abaluck J, Ahuja A, Alsan M, Banerjee A, et al. End COVID-19 in low- and middle-income countries. Science. (2022) 375:1105–10. 10.1126/science.abo4089
[23] Darcy Jimenez . Covid-19: Vaccine Pricing Varies Wildly by Country Company. Pharmaceutical Technology (2021). Available online at: https://www.pharmaceutical-technology.com/analysis/covid-19-vaccine-pricing-varies-country-company/ (accessed November 1, 2022).
[24] Hasell J, Mathieu E, Beltekian D, Macdonald B, Giattino C, Ortiz-Ospina E, et al. A cross-country database of COVID-19 testing. Sci Data. (2020) 7:345. 10.1038/s41597-020-00688-8
[25] Lopez Bernal J, Andrews N, Gower C, Gallagher E, Simmons R, Thelwall S, et al. Effectiveness of COVID-19 vaccines against the B16172 (Delta) variant. N Engl J Med. (2021) 385:585–94. 10.1056/NEJMoa2108891 [DOI] [PMC free article] [PubMed] [Google Scholar]
[26] Mlcochova P, Kemp SA, Dhar MS, Papa G, Meng B, Ferreira IATM, et al. SARS-CoV-2 B16172 delta variant replication and immune evasion. Nature. (2021) 599:114–9. 10.1038/s41586-021-03944-y
[27] The Organisation for Economic Co-operation Development (OECD). Coronavirus (COVID-19) Vaccines for Developing Countries: An Equal Shot at Recovery. OECD (2021). Available online at: https://www.oecd.org/coronavirus/policy-responses/coronavirus-covid-19-vaccines-for-developing-countries-an-equal-shot-at-recovery-6b0771e6/ (accessed November 1, 2022).
[28] Wouters OJ, Shadlen KC, Salcher-Konrad M, Pollard AJ, Larson HJ, Teerawattananon Y, et al. Challenges in ensuring global access to COVID-19 vaccines: production, affordability, allocation, and deployment. Lancet. (2021) 397:1023–34. 10.1016/S0140-6736(21)00306-8
[29] World Health Organization. Fair Allocation Mechanism for COVID-19 Vaccines Through the COVAX Facility (2020). Available online at: https://www.who.int/publications/m/item/fair-allocation-mechanism-for-covid-19-vaccines-through-the-covax-facility (accessed December 5, 2022).
[30] Bubar KM, Reinholt K, Kissler SM, Lipsitch M, Cobey S, Grad YH, et al. Model-informed COVID-19 vaccine prioritisation strategies by age and serostatus. Science. (2021) 371:916–21. 10.1126/science.abe6959
[31] Hogan AB, Winskill P, Watson OJ, Walker PGT, Whittaker C, Baguelin M, et al. Within-country age-based prioritisation, global allocation, and public health impact of a vaccine against SARS-CoV-2: a mathematical modelling analysis. Vaccine. (2021) 39:2995–3006. 10.1016/j.vaccine.2021.04.002
[32] Sudharsanan N, Bloom DE. The Demography of Aging in Low- Middle-Income Countries: Chronological versus Functional Perspectives. National Academies Press (US) (2018). Available online at: http://www.ncbi.nlm.nih.gov/books/NBK513069/ (accessed December 5, 2022).
[33] Solís Arce JS, Warren SS, Meriggi NF, Scacco A, McMurry N, Voors M, et al. COVID-19 vaccine acceptance and hesitancy in low- and middle-income countries. Nat Med. (2021) 27:1385–94. 10.1038/s41591-021-01454-y
[34] COVID 19 Vaccine Perceptions: A 15 Country Study. African Union | Africa CDC. Available online at: https://africacdc.org/download/covid-19-vaccine-perceptions-a-15-country-study/ (accessed October 20, 2022).
[35] Neumann-Böhme S, Varghese NE, Sabat I, Barros PP, Brouwer W, van Exel J, et al. Once we have it, will we use it? A European survey on willingness to be vaccinated against COVID-19. Eur J Health Econ. (2020) 21:977–82. 10.1007/s10198-020-01208-6
[36] Amo-Adjei J, Nurzhynska A, Essuman R, Lohiniva A-L. Trust and willingness towards COVID-19 vaccine uptake: a mixed-method study in Ghana, 2021. Arch Public Health. (2022) 80:64. 10.1186/s13690-022-00827-0
[37] Parthasarathi A, Puvvada RK, Shankar M, Siddaiah JB, Ganguly K, Upadhyay S, et al. Willingness to accept the COVID-19 vaccine and related factors among Indian Adults: a cross-sectional study. Vaccines. (2022) 10:1095. 10.3390/vaccines10071095
[38] Abedin M, Islam MA, Rahman FN, Reza HM, Hossain MZ, Hossain MA, et al. Willingness to vaccinate against COVID-19 among Bangladeshi adults: understanding the strategies to optimise vaccination coverage. PLoS ONE. (2021) 16:e0250495. 10.1371/journal.pone.0250495
[39] Patwary MM, Bardhan M. Haque MdZ, Sultana R, Alam MA, Browning MHEM. COVID-19 vaccine acceptance rate and its factors among healthcare students: a systematic review with meta-analysis. Vaccines. (2022) 10:806. 10.3390/vaccines10050806
[40] Ye Y, Zhang Q, Wei X, Cao Z, Yuan H-Y, Zeng DD. Equitable access to COVID-19 vaccines makes a life-saving difference to all countries. Nat Hum Behav. (2022) 6:207–16. 10.1038/s41562-022-01289-8
Appendix
Appendix 1
| Data Description | Source | URL |
| COVID-19 Deaths, Case Counts, Vaccination Rates, Date of First Vaccine, and First Vaccine Authorisation | World Health Organisation | https://covid19.who.int/data
|
| Income Categorisation | World Bank | http://databank.worldbank.org/data/download/site-content/CLASS.xlsx |
| Population Size | World Bank | https://data.worldbank.org/indicator/SP.POP.TOTL |
| Testing Data | Our World in Data | https://github.com/owid/covid-19-data/tree/master/public/data |
Appendix 2
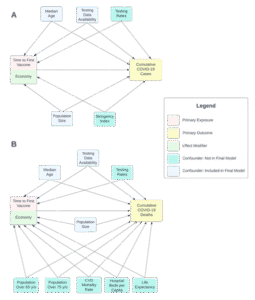
Figure: Directed acyclic graphs (DAGs) representing the hypothesised ecological causal relationship between time to first vaccine and COVID-19 cases and deaths
Appendix 3
Comparing COVID-19 Testing Data Availability by Economic Classifications. Odds ratios (OR) were estimated using simple logistic regression, in which the odds of no data availability were modeled as the outcome.
| Economic Classification | Testing Data Availability | |||
| N | Not Available
n (%) |
Available
n (%) |
OR (95% CI)
p-value* |
|
| Overall | ||||
| World Bank Income Classification | 170 | 77 | 93 | |
| Low Income | 23 | 17 (73.91) | 6 (26.09) | 9.917 (3.202, 30.711)
< 0.0001 |
| Lower Middle Income | 51 | 31 (60.78) | 20 (39.22) | 5.425 (2.31, 12.730)
0.0001 |
| Upper Middle Income | 42 | 17 (40.48) | 25 (59.52) | 2.380 (0.978, 5.793)
0.0561 |
| High Income | 54 | 12 (22.22) | 42 (77.78) | Reference |
| GDP PPP Classification | 168 | 75 | 93 | |
| <7.47 | 19 | 14 (73.68) | 5 (26.32) | 15.862 (3.214, 78.288)
0.0007 |
| 7.78-8.48 | 29 | 21 (72.41) | 8 (27.59) | 14.870 (3.409, 64.857)
0.0003 |
| 8.49-9.47 | 48 | 23 (47.92) | 25 (52.08) | 5.212 (1.349, 20.135)
0.0167 |
| 9.48-10.46 | 52 | 14 (26.92) | 38 (73.08) | 2.087 (0.529, 8.227)
0.2931 |
| >10.46 | 20 | 3 (15.00) | 17 (85.00) | Reference |
| GDP PPP (Continuous) | ||||
| Mean (95% CI) | 24.155
(23.363, 24.947) |
26.299
(25.711, 26.888) |
-2.144 (-3.095, -1.194) **
<0.001 *** |
|
* P-value for beta coefficient
** Mean difference between groups and 95% CI
*** P-value for t-test with equal variance (Equality of Variances: p = 0.0725).
Appendix 4
Comparing mean time to first vaccine (days) by World Bank Income category (F3,164 = 32.58, p <0.001). Cells represent mean difference between indicated groups and 95% confidence intervals on the second row.
| World Bank Income Category | Lower middle income | Upper middle income | High income |
| Low income | 32.756
(-6.17, 71.682) |
54.316
(14.153, 94.48) * |
89.533
(50.829, 128.238) * |
| Lower middle income | 21.56
(-10.238, 53.359) |
56.778
(26.843, 86.712) * |
|
| Upper middle income | 35.217
(3.691, 66.744) * |
* p < 0.001 (Bonferroni-corrected
Appendix 5
Comparing mean time to first vaccine (days) by GDP category (F4,163 = 26.34, p <0.001). Cells represent mean difference between indicated groups and 95% confidence intervals on the second row.
| GDP Category | 7.78 – 8.48 | 8.49 – 9.47 | 9.48 – 10.46 | > 10.46 |
| < 7.47 | 24.822
(-21.221, 70.865) |
48.559
(6.277, 90.842) * |
80.838
(39.019, 122.657) * |
100.034
(50.058, 150.01) * |
| 7.78 – 8.48 | 23.737
(-12.953, 60.427) |
56.016
(19.861, 92.17) * |
75.212
(29.87, 120.554) * |
|
| 8.49 – 9.47 | 32.279
(1.054, 63.504) * |
51.475
(9.957, 92.993) * |
||
| 9.48 – 10.46 | 19.196
(-21.85, 60.242)
|
* p < 0.001 (Bonferroni-corrected
Appendix 6
| Assessing The Interaction Between Economic Classification On The Associations Between Time To First Vaccine And Cumulative Mortality. Modeled using multiple linear regression, p-values for t-test unless otherwise indicated. | ||||||
| Parameter | Cumulative Deaths | |||||
| Crude Model | Full model without Interaction * | Full Model with Interaction * | ||||
| β (95% CI) | p-value | β (95% CI) | p-value | β (95% CI) | p-value | |
| I. World Bank Income Classifications | ||||||
| Days to Vaccine | -0.023 (-0.031, -0.015) | <0.0001 | -0.007 (-0.015, 0.001) | 0.0718 | -0.019 (-0.037, -0.002) | 0.0336 |
| Income Classifications | ||||||
| Low Income | -0.79 (-2.426, 0.847) | 0.342 | -1.492 (-11.108, 8.124) | 0.7596 | ||
| Lower Middle Income | -0.277 (-1.463, 0.908) | 0.6448 | -2.504 (-11.319, 6.312) | 0.5755 | ||
| Upper Middle Income | 0.697 (-0.196, 1.59) | 0.125 | -9.821 (-18.015, -1.628) | 0.0191 | ||
| High Income | — | — | — | — | ||
| Income Classifications x Days to Vaccine | ||||||
| Low Income | 0.004 (-0.019, 0.026) | 0.7541 | ||||
| Lower Middle Income | 0.007 (-0.016, 0.029) | 0.5627 | ||||
| Upper Middle Income | 0.027 (0.006, 0.048) | 0.0134 | ||||
| High Income | — | — | ||||
| II. GDP PPP | ||||||
| Days to Vaccine | -0.007 (-0.015, 0.001) | 0.0681 | -0.079 (-0.147, -0.011) | 0.0239 | ||
| GDP PPP | 0.109 (-0.429, 0.647) | 0.6889 | -1.072 (-2.314, 0.17) | 0.0901 | ||
| GDP PPP x Days to Vaccine | 0.003 (0, 0.005) | 0.0392 | ||||
| III. GDP PPP per Capita | ||||||
| Days to Vaccine | -0.008 (-0.016, -0.001) | 0.0336 | -0.024 (-0.052, 0.004) | 0.0942 | ||
| GDP** | ||||||
| < 7.47 | 0.568 (-1.089, 2.224) | 0.4996 | -1.881 (-14.469, 10.708) | 0.7683 | ||
| 7.78 – 8.48 | 1.117 (-0.319, 2.554) | 0.1265 | 2.062 (-11.348, 15.472) | 0.7617 | ||
| 8.49 – 9.47 | 1.308 (0.189, 2.427) | 0.0223 | -7.088 (-19.308, 5.133) | 0.2537 | ||
| 9.48 – 10.46 | 1.096 (0.147, 2.045) | 0.0239 | -8.219 (-19.485, 3.047) | 0.1516 | ||
| > 10.46 (Reference) | — | — | — | — | ||
| Days to Vaccine x GDP** | ||||||
| < 7.73 | 0.009 (-0.023, 0.041) | 0.5871 | ||||
| 7.74 – 8.97 | 0.001 (-0.034, 0.035) | 0.9754 | ||||
| 8.98 – 10.21 | 0.022 (-0.01, 0.054) | 0.1745 | ||||
| 9.48 – 10.46 | 0.025 (-0.005, 0.055) | 0.1067 | ||||
| > 10.21 (Reference) | — | — | — | — | ||
GDP = Gross domestic product; PPP = Purchasing power parity
*Adjusted for 2021 population size, median age, and testing data availability (yes/no)
**Log-transformed
Appendix 7
Assessing the interaction between economic size and days to first COVID-19 vaccine on estimated log-cumulative mortality. Adjusted for 2021 population size, median age, and testing data availability (yes/no). Shaded bands indicate 95% prediction intervals.
Appendix 8
Contour plot demonstrating the interaction between log-GDP PPP and days to first COVID-19 vaccine on cumulative mortality estimated using multiple linear regression and adjusted for 2021 population size, median age, and testing data availability (yes/no).