Abstract
Background: Delivering health services tends to be more efficient in densely populated areas compared to sparsely populated ones, assuming other factors remain constant. This suggests that higher population density may lead to better coverage of health services. While this hypothesis has been explored indirectly at local levels for certain services, it has not been extensively tested at a national scale.
Methods: Using cross-sectional data, we perform cross-country ordinary least squares (OLS) regressions to examine the relationship between population density and maternal health coverage at the national level. We analyze the effects of two different density measures on three maternal health coverage indicators, resulting in six separate estimates. Our coverage indicators include the proportion of pregnant women completing at least four antenatal care visits, and utilization rates of skilled birth attendants and in-facility deliveries. The first density measure is the percentage of the population residing in urban areas, while the second is a density score that ranks countries by population density after excluding uninhabited areas, based on the premise that such areas do not impact service delivery.
Results: Our findings reveal a statistically significant positive association between population density and all three maternal health coverage indicators. Specifically, a one-unit increase in the density score corresponds, on average, to a 0.2% increase in coverage rates.
Conclusions: Countries with more dispersed populations encounter greater challenges in meeting international maternal health coverage targets, such as those outlined in the United Nations’ Millennium Development Goals.
Keywords: Population density, Maternal health coverage, Obstetric care, Antenatal visits, Skilled birth attendance, Facility delivery
Background
It is widely acknowledged that certain social services are more effectively delivered in areas with concentrated populations [1]. This concept has also been indirectly applied to health services by two distinct groups of researchers. The first group examines population density as an independent factor in studies on service coverage and health outcomes. In research using aggregated population data, population density is often treated as a continuous variable [2-4], whereas patient-level studies tend to consider it as a binary characteristic [5,6]. However, in much of this literature, population density is not the primary focus but rather a secondary consideration.
The second group of researchers focuses on the impact of distance or travel time on the utilization of health services [7-11]. These studies consistently find that shorter distances or travel times increase service use. Yet travel time depends on multiple factors, including how people are spatially distributed. Assuming health system resources remain unchanged, populations living in denser areas generally face shorter travel times compared to those in more dispersed settings. Based on findings from the travel time literature, we propose that population density itself may be a key determinant influencing coverage rates.
Testing this hypothesis comprehensively would require detailed data on service coverage, population density, road infrastructure, and health facility locations over time. Unfortunately, such comprehensive data are unavailable for any single country, let alone across multiple nations. Therefore, in this study, we conduct a cross-country, cross-sectional analysis to explore the relationship between population density and coverage levels of three maternal health services. To our knowledge, this is the first national-level investigation of this association. Understanding this relationship is critical, particularly given the challenges countries with dispersed populations may face in meeting global coverage targets such as the United Nations’ Millennium Development Goals (MDGs) [12]. If population density significantly affects coverage, countries with scattered populations may encounter greater difficulties in achieving uniform health service targets..
Method
We execute a cross-sectional analysis of 178 countrylevel observations. This is represented by equation (1), in which the subscript c denotes a country-specific variable. To hold the health system’s resources constant, we include per capita health expenditure and the number of hospital beds per 1,000 people in the country. We further include the total fertility rate and the number of four-wheel vehicles per capita as determinants of demand. The hypothesis under consideration predicts β1 > 0.
We utilize three different coverage indicators from 2009: (i) the percentage of pregnant women who complete four antenatal care visits before giving birth; (ii) the percentage of deliveries assisted by a skilled birth attendant; and (iii) the percentage of births occurring in healthcare facilities. These data are sourced from the Institute for Health Metrics and Evaluation (IHME) [13], which, to our knowledge, provides the most comprehensive national-level estimates for these services. For health expenditure, we use the natural logarithm of total per capita health spending in 2009, measured in real US dollars, as reported by the World Health Organization [14]. Additionally, data on the number of four-wheel vehicles, hospital beds, and total fertility rates come from IHME [13]. These independent variables are contemporaneous with the dependent variables, as we expect minimal to no time lag in their influence on coverage levels. One challenge in incorporating population density lies in selecting an appropriate metric to capture the concept accurately. Common density measures may not be suitable for cross-country comparisons for several reasons. For instance, a simple national ratio of population to total land area often includes uninhabited regions, which are irrelevant when analyzing health service provision because services are generally not available in unpopulated areas. Including these “empty spaces” tends to downwardly bias the population density measure for some countries. Alternative metrics, such as the percentage of people living in “urban” or “dense” areas, may be more relevant to studying health service availability. However, the definitions of “urban” and “dense” differ widely between countries [15,16], and many efforts to reconcile these definitions tend to confound population density with wealth [17]. Due to these complications, it remains unclear whether prevailing metrics are appropriate for cross-country analysis, which partly explains the scarcity of research investigating the effect of population density on health service provision [18].
To address this, we use two separate population density measures: (i) the percentage of the population living in urban areas; and (ii) a novel “density score” developed specifically for this study. Both measures are calculated using data from the Global Rural–Urban Mapping Project (GRUMP) Alpha Version, based on the year 2000 [19,20]. We chose GRUMP for three reasons: first, it offers global coverage with a single, consistent dataset; second, it is freely accessible; and third, it provides highly detailed population estimates on a consistent scale. This contrasts with datasets like the Gridded Population of the World (GPW), which reports population and area by administrative units that vary greatly in size across countries. For example, in Saudi Arabia, only thirteen administrative units cover both populous cities and large uninhabited desert areas, making density measures less precise. Since granular population data is only available for the year 2000, our density metrics reflect that year. Although this is not contemporaneous with our dependent variables from 2009, we assume population density did not change drastically during this period, especially at the global scale. Using data from 2000 also ensures that density is predetermined relative to the dependent variable, supporting the use of ordinary least squares estimation. The GRUMP data uses a spatial resolution of 30 arc seconds, approximately one square kilometer at the equator, with grid area shrinking toward the poles following a cosine function. We consider this variation negligible for our analysis because (a) distortions caused by assigning populations to uninhabited areas are limited due to the small grid size, and (b) very few significant settlements exist above 65° latitude where grid size decreases substantially.
We rely on GRUMP’s “unadjusted” population estimates, which differ slightly from official UN population figures. Although an “adjusted” version exists to align with UN totals, we prefer the unadjusted data because the discrepancies are minor, and the adjustment method is not clearly documented. Furthermore, using adjusted data does not affect our findings, as results remain consistent across both versions. GRUMP classifies certain grids as “urban” based on satellite imagery of nightlights. We use the population within these grids to calculate the first density measure: the percentage of a country’s population living in urban areas. However, since nightlight intensity correlates strongly with wealth [23,24], this metric may partially reflect economic status rather than pure population density. This potential confounding motivates the use of our novel density score. To calculate the density score, we first determine global population density deciles using GRUMP data, where each decile contains 10% of the global population. For each country, we then calculate the share of its population living within each global density decile. Formally, let ddd represent the decile and popc,d\text{pop}_{c,d}popc,d the percentage of country ccc’s population in decile ddd. The density score for each country is computed as a weighted average across these deciles, as shown in equation (2).
Our approach to calculating a density score closely follows the method described by Craig (1984), who analyzed population density patterns in Great Britain [25]. Since these scores are derived from global density deciles, they effectively represent a relative ranking of density among countries. For instance, if a country’s entire population is concentrated within the lowest global decile, it receives a score of zero. Conversely, if the population is entirely within the highest decile, the score is one hundred. If the population distribution aligns exactly with the global pattern—meaning one-tenth of the population falls within each decile—the score is fifty. While we could have chosen alternative quantiles such as vigintiles or percentiles instead of deciles, or applied different weighting schemes rather than the uniform discounting used in equation (3), these variations would likely only cause minor changes in the score distribution without affecting their relative ranking. Because our regression analysis depends primarily on the ranking order of these scores, our choice has limited influence on the study’s results. Nevertheless, alternative methods might affect the size of the estimated effect and consequently the policy interpretations (see the Discussion section).
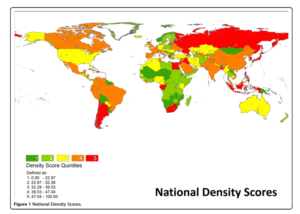
Table 1 presents the population density thresholds for global deciles in the year 2000, derived from GRUMP data. According to this data, 50% of the world’s population lived in areas where the population density exceeded 564 persons per square kilometer. Figure 1 shows a national-level map categorizing density scores into quintiles. The weighting method used in this analysis significantly influences the results for some countries. For instance, based on a simple calculation of population divided by total land area, Russia’s density appears very low—under 10 persons per square kilometer—and Egypt’s density is around 30 persons per square kilometer. These figures suggest that populations in these countries are very spread out. However, when excluding uninhabited areas, both Russia and Egypt rank as densely populated since their populations are concentrated in relatively small regions.
Table 2 provides descriptive statistics for the variables included in the regression analysis (a detailed country-level dataset is available in the web appendix). The regression results with robust standard errors are shown in Table 3. In the six regression models, 10 observations were identified as clear outliers; however, excluding these did not affect the robustness of the findings. Comparing the two density metrics, the variable “percentage urban” consistently shows a stronger and more statistically significant association.
Table 1: Global Population Density Deciles (Year 2000)
| Decile | Population Density (persons per km²) |
| 1st | 0 ≤ 49 |
| 2nd | 49 ≤ 118 |
| 3rd | 118 ≤ 220 |
| 4th | 220 ≤ 368 |
| 5th | 368 ≤ 564 |
| 6th | 564 ≤ 849 |
| 7th | 849 ≤ 1,321 |
| 8th | 1,321 ≤ 2,433 |
| 9th | 2,433 ≤ 5,201 |
| 10th | Over 5,201 |
Table 2: Descriptive Statistics of Variables Used in Regression Analysis
| Variable | Mean | Standard Deviation | Median | Skewness |
| Antenatal visits (rate completing 4 visits) | 0.693 | 0.218 | 0.787 | -0.93 |
| Skilled birth attendant (rate) | 0.819 | 0.232 | 0.958 | -1.28 |
| In-facility delivery (rate) | 0.793 | 0.249 | 0.941 | -1.13 |
| Percent population “urban” | 52.8 | 24.6 | 55.2 | -0.08 |
| Density score | 35.9 | 13.9 | 34.8 | 0.52 |
| Log per capita health expenditure | 6.0 | 1.4 | 6.1 | 0.00 |
| Hospital beds (per 1,000 population) | 3.7 | 3.0 | 2.7 | 0.97 |
| Total fertility rate | 2.9 | 1.5 | 2.4 | 0.90 |
| Number of 4-wheel vehicles (per capita) | 0.239 | 0.288 | 0.121 | 1.78 |
Our weighting method has a significant impact on the results. Using a simple, unadjusted calculation of population divided by total land area, Russia’s population density appears to be less than 10 persons per square kilometer, and Egypt’s around 30 persons per square kilometer. By this measure, both countries seem to have very dispersed populations. However, when uninhabited regions are excluded, the picture changes—populations in both countries are actually quite concentrated within relatively small inhabited areas, making their effective densities much higher. Table 2 presents descriptive statistics for the variables included in the regression analysis, with the full country-level dataset available in the web appendix. The regression results, which include robust standard errors, are shown in Table 3. Although 10 observations were identified as clear outliers across the six regression models, excluding these did not affect the overall robustness of the findings. When comparing the two density measures, the variable “percentage urban” consistently exhibits a stronger and more statistically significant association.
Table 3: Regression Results
| Dependent Variable | ANC4 (Antenatal Visits) | SBA (Skilled Birth Attendant) | IFD (In-Facility Delivery) |
| % Urban | Density Score | % Urban | |
| Density Variable | 0.003*** | 0.002** | 0.004*** |
| (0.001) | (0.001) | (0.001) | |
| ln(Health Expenditure) | 0.07*** | 0.101*** | 0.073*** |
| (0.011) | (0.008) | (0.011) | |
| Hospital Beds (per capita) | 0.003 | 0.000 | 0.006 |
| (0.006) | (0.006) | (0.006) | |
| Total Fertility Rate | −0.009 | −0.009 | 0.000 |
| (0.011) | (0.011) | (0.010) | |
| # 4-Wheel Vehicles (per capita) | 0.035 | 0.068 | 0.014 |
| (0.057) | (0.059) | (0.052) | |
| Constant | 0.130 | 0.039 | 0.154** |
| (0.066) | (0.070) | (0.062) |
Note: Standard errors are shown in parentheses below each coefficient. Significance levels are indicated as follows:
***p < 0.01, **p < 0.05, *p < 0.1
The regression analysis conducted across three separate models utilized the density score as a key explanatory variable to investigate its association with maternal health service coverage. The dependent variables in these models were indicators of maternal healthcare utilization, specifically: the rate of women completing at least four antenatal care visits (ANC4), the proportion of births attended by skilled birth attendants (SBA), and the rate of in-facility deliveries (IFD). The main aim was to assess how population density, alongside other health system and socioeconomic factors, influences the uptake of these essential maternal health services. One of the most notable findings from the analysis was the statistically significant and positive impact of per-capita health expenditure on maternal health coverage across all three regression models that incorporated the density score. It is important to highlight that, although the dependent variables are expressed in their original scales (i.e., they were not transformed or logged), the health expenditure variable was included as a natural logarithm (ln) of per-capita expenditure. This log transformation is commonly used in regression analysis to account for diminishing returns and to linearize the relationship between expenditure and health outcomes, facilitating easier interpretation of elasticities.
The interpretation of the coefficient for the logged expenditure variable follows the principles of elasticity in economics. Specifically, a one-unit increase in the natural logarithm of health expenditure corresponds to a multiplicative increase in the actual expenditure by a factor of e (approximately 2.7182). In other words, when per-capita health expenditure increases by about 171.8% (i.e., it nearly triples), the model predicts a corresponding increase in the maternal health service coverage by an amount equal to the estimated coefficient β. The estimated point coefficients for health expenditure ranged from 0.101 in the antenatal visits regression to 0.129 in the in-facility delivery regression. This suggests that a roughly 2.7-fold increase in health expenditure per capita is associated with an approximately 10.1% increase in the rate of women completing four antenatal visits, and a 12.9% increase in the proportion of births occurring in health facilities. To put it simply, countries that invest more substantially in health per person tend to see higher usage of maternal health services, underscoring the crucial role of financial resources in improving healthcare access and quality.
This positive relationship is consistent with the broader literature on health economics, which has repeatedly shown that higher investments in health systems correlate with improved health outcomes and increased utilization of essential health services. The fact that health expenditure has a stronger effect on in-facility delivery than on antenatal visits might reflect that facility-based care often requires more financial and infrastructural resources, such as staffed health centers and medical equipment, than antenatal visits, which can sometimes be provided in less resource-intensive settings. In addition to health expenditure, the population density score also demonstrated a statistically significant positive association with maternal health service coverage. The density score variable was designed to capture how concentrated or dispersed a country’s population is, taking into account inhabited areas rather than total land area, thus providing a more accurate representation of population clustering.
According to the regression results, a one-unit increase in the population density score correlates with a 0.2% increase in maternal health coverage for all three outcomes analyzed—antenatal visits, skilled birth attendance, and in-facility delivery. Although this effect size may appear small on a per-unit basis, it becomes meaningful when considering that density scores vary widely across countries. A country with a higher population density score tends to have populations living closer together, which can facilitate better access to health services through economies of scale, improved infrastructure, and more efficient health service delivery. From a policy perspective, these findings highlight the importance of considering population distribution when planning health services. Densely populated areas often benefit from easier access to healthcare facilities, greater availability of medical staff, and enhanced opportunities for community health interventions. Conversely, countries with low population density may face challenges in reaching remote populations, resulting in lower service coverage. Thus, the positive link between density and maternal health utilization supports targeted strategies that address geographic barriers and service delivery challenges in less densely populated regions.
The regression analysis also included other potentially influential variables such as the number of hospital beds per capita, total fertility rate, and the number of 4-wheel vehicles per capita as a proxy for wealth or transportation access. Interestingly, these variables did not reach statistical significance in any of the models. The lack of significant effect from the number of hospital beds per capita may be explained by several factors. While hospital bed availability is a fundamental aspect of health infrastructure, it does not necessarily translate directly into better maternal health service utilization if other elements such as healthcare quality, staff availability, or geographic accessibility are lacking. Moreover, hospital bed counts do not capture the distribution of these beds within countries—beds may be concentrated in urban centers while rural areas remain underserved. Hence, the simple count of beds per capita may not be a sensitive indicator of effective access to maternal health services. Similarly, the total fertility rate was not significantly associated with the outcomes. While fertility rate can influence demand for maternal health services, it may also reflect deeper social, cultural, and economic factors not fully captured in the model. It is possible that fertility rate operates through more complex pathways or interacts with other variables not included here.
Finally, vehicle ownership, used as a proxy for economic status and mobility, also failed to show a statistically significant effect. This result might suggest that while transportation availability is important, it may be less directly linked to maternal health service uptake at the national level or may be overshadowed by stronger determinants such as health expenditure and urbanization/density. Additionally, the ownership of 4-wheel vehicles does not necessarily represent equitable access to transportation, especially in rural or poorer populations where other forms of transport might be used. Overall, the regression results demonstrate that both financial investment in health (per-capita health expenditure) and population distribution (density score) are significant drivers of maternal health service coverage. The findings emphasize that increasing health expenditure has a measurable positive effect on key maternal health outcomes, with larger expenditure gains associated with higher utilization rates. At the same time, population density matters because concentrated populations can more efficiently access health services, suggesting that spatial factors should be integral to health planning. The insignificance of hospital bed counts, fertility rates, and vehicle ownership in these models indicates that while these variables are important, their effects may be context-dependent or mediated by other factors. Future research could explore these relationships further, perhaps with more granular data or additional covariates.
Discussion
Increasing the log of per capita health expenditure by one unit is associated with approximately an 11% increase in coverage across the three interventions studied. This translates to roughly a 0.04% increase in coverage for every 1% increase in health expenditure per capita. In comparison, increasing the population density score by one unit results in about a 0.2% increase in coverage. While this shows that population density has an effect, policymakers have limited control over density itself, making health expenditure a more actionable factor. These findings suggest that different countries face unique challenges in meeting multinational targets such as the Millennium Development Goals (MDGs). For example, Benin and Mali have similar health expenditure per capita, but Benin’s population is significantly denser and coverage rates are correspondingly higher—indicating that population density may partly explain these differences.
Population density scores could be more useful for policymakers if calculated at regional or national levels rather than globally. For instance, analysts focused on Africa might develop density scores based on African population deciles, or U.S. states could be scored according to U.S. population deciles. Although policymakers cannot directly change population density, they can influence related factors like infrastructure development or building regulations, especially in developed countries. Ultimately, the choice of density metric depends on the specific analysis. We argue that the method used here offers a methodological improvement over traditional population density measures and should be considered by analysts seeking to control for density effects.
As noted in the Methods section, the magnitude of the results may depend on how the density scores are calculated, though their direction remains stable. For example, one could use a weighting scheme that reduces differences among the lowest deciles but exaggerates differences among the highest deciles. While there is no strong reason to prefer such a scheme over the linear one we applied, analysts interested in emphasizing high-density differences might use a quadratic weighting (e.g., (d−1/9)2(d – 1/9)^2(d−1/9)2) to skew the scores leftward, or a square root weighting to skew them rightward. Such skewness can affect statistical inferences by introducing heteroskedasticity and inefficient estimation, potentially obscuring real effects. This does not imply that score distributions must be symmetric or that emphasizing low or high decile differences is always inappropriate. Rather, it highlights that the construction of population density metrics matters, and analysts should carefully consider these issues when applying or adapting our approach.
Conclusions
This study explores the impact of population density on maternal health service coverage, marking the first national-level analysis of this relationship. Our findings indicate a positive association between population density and coverage rates, which carries important implications for demographers, public health researchers, and policymakers. Countries with lower population densities face greater challenges in achieving widespread coverage of key health services. Consequently, these countries may require increased per capita resources to meet international coverage goals, such as the Millennium Development Goals (MDGs).
Competing Interests
The authors declare no competing interests.
Authors’ Contributions
MH designed the analytical approach, including the development of density scores, and drafted the manuscript. RB managed the geospatial data processing from GRUMP. SHM and RZ performed the empirical analyses. All authors reviewed and approved the final version of the manuscript.
Acknowledgements
We thank Kelsey Moore for her project management support. This research was funded by the Institute for Health Metrics and Evaluation through core funding from the Bill & Melinda Gates Foundation.
Author Details
- Institute for Health Metrics and Evaluation, University of Washington, 2301 5th Avenue, #600, Seattle, WA 98121, USA
- Feinberg School of Medicine, Northwestern University, Seattle, USA
References
- Alegana VA, Wright JA, Pentrina U, Noor AM, Snow RW, Atkinson PM: Spatial modeling of healthcare utilization for treatment of fever in Namibia. Int J Health Geogr 2012, 11:6.
- Astell-Burt T, Flowerdew R, Boyle PJ, Dillon JF: Does geographic access to primary healthcare influence the detection of hepatitis C? Soc Sci Med 2011, 72.9:1,472–1,481.
- Balk D: More Than a Name: Why Is Global Urban Population Mapping a GRUMPy Proposition? In Global Mapping Of Human Settlements: Experiences, Datasets and Prospects. Edited by Gamba P, Herold M. Boca Raton: CRC Press; 2009.
- Center for International Earth Science Information Network, Columbia University; International Food Policy Research Institute; The World Bank; and Centro Internacional de Agricultura Tropical: Global Rural–urban Mapping Project (GRUMP), Alpha Version. Palisades: Socioeconomic Data and Applications Center, Columbia University; 2004. Data downloaded November 2010 from http://sedac.ciesin.columbia.edu/gpw.
- Gabrysch S, Cousens S, Cox J, Campbell OM: The influence of distance and level of care on delivery place in rural Zambia: a study of linked national data in a geographic information system. PLoS Med 2011, 8.1:e1000394. doi:10.1371/journal.pmed.1000394.
- Galea S, Freudenberg N, Vlahov D: Cities and population health. Soc Sci Med 2005, 60(5):1017–1033.
- Haggblade S, Longabaugh S, Tschirley DL: Spatial patterns of food staple production and marketing in South East Africa: implications for trade policy and emergency response. Unpublished manuscript: http://econpapers.repec.org/paper/agsmidiwp/54553.htm.
- Haaland CM, Health MT: Mapping of Population Density. Demography 1974, 11(2):321–336.
- Institute for Health Metrics and Evaluation: Health Metrics Covariate Database. Seattle, WA: Institute for Health Metrics and Evaluation; 2011.
- Lu, et al: Outcomes of prolonged mechanic ventilation: a discrimination model based on longitudinal health insurance and death certificate data. BMC Health Serv Res 2012, 12(100). doi:10.1186/1472-6963-12-100.
- Lovett A, Haynes R, Sünnenbergand G, Gale S: Car travel time and accessibility by bus to general practitioner services: a study using patient registers and GIS. Soc Sci Med 2002, 55.1:97–111.
- Mitchell R, Popham F: Effect of exposure to natural environment on health inequalities: an observational population study. Lancet 2008, 372(9650):1655–1660.
- Nations U: World Urbanization Prospects: The 2009 Revision. New York, NY: The United Nations; 2009.
- Newacheck PW, Hung Yun Y, Park MJ, Brindis M, Irwin CE: Disparities in adolescent health and health care: does socioeconomic status matter? Health Serv Res 2003, 38(5):1235–1252.
- Rank MR, Hirschl TA: The link between population density and welfare participation. Demography 1993, 30(4):607–622.
- Stairs RA: The concept of population density: a suggestion. Demography 1977, 14(2):243–244.
- Tanser F, Gijsbertsen B, Herbst K: Modelling and understanding primary health care accessibility and utilization in rural South Africa: an exploration using a geographical information system. Soc Sci Med 2006, 63.3:691–705.
- Terschuren C, Mensing M, Mekel OCL: Is telemonitoring an option against shortage of physicians in rural regions? Attitude towards telemedical devices in the North Rhine-Westphalian health survey, Germany. BMC Health Serv Res 2012, 12(95). doi:10.1186/1472-6963-12-95.
- United Nations: Millennium Development Goals Report 2011; June 2011, ISBN 978-92-1-101244-6, available at: http://www.unhcr.org/refworld/docid/4e42118b2.html [accessed 5 June 2012].
- United Nations Statistical Division; Source (accessed October 2011): http://unstats.un.org/unsd/demographic/sconcerns/densurb/densurbmethods.htm.
- Wright JA, Polack C: Understanding variation in measles-mumps-rubella immunization coverage—a population-based study. Eur J Public Health 2005, 16(2):137–142.
- World Health Organization: National Health Accounts: Country Health Information; Source (accessed April 2011): http://www.who.int/nha/country/en/.
- Ebener S, Murray CJL, Tandon A, Elvidge C: From wealth to health: modelling the distribution of income per capita at the sub-national level using night-time light imagery. Int J Health Geogr 2004, 4:5.