Dr. Eleanor M. Carter¹, Prof. David H. Lindström²
1 Department of Public Health, University of Edinburgh, Edinburgh, UK
2 Institute for Social Policy and Research, University of Oslo, Oslo, Norway
* Correspondence should be addressed to Dr. Sofia R. Ahmed, Department of Public Health University of Edinburgh Edinburgh EH8 9AG, United Kingdom Email: [email protected]
Abstract
This study examined whether the structure of national social policies, reflected through welfare state regimes, influences the likelihood of food insecurity. A cross-sectional analysis was performed using 2017 individual-level food insecurity survey data from the United Nations Food and Agriculture Organization, covering 19 countries—the most recent dataset available prior to the COVID-19 pandemic. Nations were classified into three welfare state categories: liberal (e.g., the United States), corporatist (e.g., Germany), and social democratic (e.g., Norway). Food insecurity probability, benchmarked to an international standard, was derived through a Rasch model. Linear regression was employed to assess differences across regimes, adjusting for per-capita gross domestic product, demographic factors, and household composition. The sample included 19,008 individuals, with a mean food insecurity probability of 0.067 (SD: 0.217). Adjusted results demonstrated that, relative to liberal regimes, food insecurity probability was significantly lower in both corporatist regimes (risk difference: −0.039, 95% CI −0.066 to −0.011, p = .006) and social democratic regimes (risk difference: −0.037, 95% CI −0.062 to −0.012, p = .004). These findings suggest that welfare state design plays a critical role in shaping food insecurity outcomes. Policy reforms aimed at strengthening social protection may contribute to reducing food insecurity in high-risk contexts.
Keywords: welfare state regimes; food insecurity; social policy; comparative analysis; public health
© The Author(s) 2025. Open Access This article is licensed under a Creative Commons Attribution-NonCommercial-NoDerivatives 4.0 International License, which permits any non-commercial use, sharing, distribution and reproduction in any medium or format, as long as you give appropriate credit to the original author(s) and the source, provide a link to the Creative Commons licence, and indicate if you modified the licensed material. You do not have permission under this licence to share adapted material derived from this article or parts of it. The images or other third-party material in this article are included in the article’s Creative Commons licence, unless indicated otherwise in a credit line to the material. If material is not included in the article’s Creative Commons licence and your intended use is not permitted by statutory regulation or exceeds the permitted use, you will need to obtain permission directly from the copyright holder. To view a copy of this licence, visit https://creativecommons.org/licenses/by-nc-nd/4.0/
1.Introduction
The worldwide rise of information pollution has become an urgent concern, undermining both the stability of societies and the functioning of democratic systems. Healthy democracies depend on citizens who can access trustworthy knowledge, freely articulate their perspectives, and benefit from independent journalism alongside equitable opportunities for information access. When people are informed by accurate and balanced data, they are better positioned to make sound choices in political and economic life. In contrast, exposure to distorted, conflicting, or deliberately misleading content online has been repeatedly shown to intensify political polarization while diminishing trust in democratic institutions and in the reliability of information itself. These dynamics become particularly visible during election periods, when disinformation strategies are frequently weaponized to delegitimize political opponents, suppress investigative journalists, or question the integrity of electoral processes. Such practices are not accidental; rather, they are intentional tools of authoritarian governance, where disinformation functions as a deliberate means of consolidating or expanding political authority.
Parallel to these challenges of information disorder is the enduring issue of food insecurity—defined as uncertain or inadequate access to sufficient food necessary for a healthy and active life.¹ Although often associated with lower-income settings, food insecurity has been increasingly recognized as a pressing public health challenge in high-income nations. Research has demonstrated its links with adverse outcomes, including deteriorating mental health, elevated rates of cardiometabolic disease, diminished health-related quality of life, and increased healthcare use and costs.²–¹⁵ Recognizing these consequences, healthcare systems and clinical organizations have progressively sought to identify and intervene in food insecurity among patients.¹⁶–²¹ Nonetheless, the problem persists at a significant scale: in 2021, more than 33 million people in the United States experienced food insecurity,¹ while in the United Kingdom, over seven million people were affected during a period of escalating cost-of-living pressures across Europe.²² ²³
Food insecurity does not arise in isolation but is rooted in social and economic arrangements that determine the allocation of resources. These distributive arrangements—policies and institutional practices governing how resources are shared—constitute the foundation of what is broadly referred to as the welfare state.²⁴ A central feature of welfare states is the set of social policies, typically supported through taxation, that aim to mitigate hardship and protect populations against risks such as illness, unemployment, or poverty.²⁵–³⁰ Such policies play a decisive role in shaping both the overall prevalence of food insecurity and its distribution across different groups within society.
Cross-national research on the welfare state and health outcomes has frequently focused on quantitative indicators such as the scale of public social spending, sometimes termed “welfare effort.”³¹–³⁵ While this approach is informative, it may overlook important distinctions regarding what kinds of policies are funded, the underlying rationales behind them, and how these arrangements have developed historically. Equally crucial, it risks obscuring how different policy elements—such as means-tested benefits, social insurance programs, universal education, and tax structures—interact to form a coherent welfare state regime.³⁶ For this reason, typological approaches that classify welfare states into regime types offer an important alternative, enabling researchers to capture broader systemic logics rather than isolated variables.²⁷
A foundational framework in this area is Esping-Andersen’s “three worlds of welfare capitalism,” first published in 1990, which introduced a typology of corporatist, liberal, and social democratic regimes.³⁷ This influential classification has generated an extensive body of research over the last three decades. While scholars have critiqued and refined certain aspects, the typology has proven remarkably durable, retaining explanatory power for phenomena such as poverty and inequality.²⁷–³⁰ ³⁸–⁴³
Corporatist (or conservative) regimes, exemplified by Germany, emphasize social partnership among state institutions, industries, and trade unions, fostering the stability of the social body through coordinated policies. Benefits tend to be family-centered, frequently segmented by occupation, and often designed with the involvement of non-governmental actors. Eligibility is commonly derived from employment status or familial ties, producing a clear distinction between insiders and outsiders. In contrast, liberal regimes—such as the United States—are grounded in a residualist, market-oriented philosophy, where the state intervenes only to address needs unmet by families or markets.³⁷ ³⁹ ⁴⁰ ⁴⁴ Liberal welfare systems thus operate primarily as “safety nets of last resort,” marked by heavy reliance on means testing, stringent eligibility requirements, and benefit reductions as incomes rise, with a sharp division between the “deserving” and “undeserving.”
Social democratic regimes, exemplified by Norway, pursue universalist approaches.³⁷ ³⁹ ⁴² ⁴⁴ Policies are designed as first-line protections available to all citizens, not contingent upon occupational status or means-testing. Participation in programs is framed as a social right rather than a conditional benefit, with universal provision intended to prevent individuals from falling into hardship in the first place.
Each of these welfare state types represents a distinct form of “welfare capitalism,” addressing the fundamental problem that markets do not provide income to those without capital or formal employment opportunities.³⁷ ⁴⁵ Historically, corporatist regimes arose in contexts of strong central states seeking citizen loyalty, bolstered by Catholic political movements emphasizing family roles.³⁷ ⁴⁶ ⁴⁷ Liberal regimes, by contrast, emerged in societies with early industrialization, less organized labor, and stronger business influence over legal structures. Social democratic regimes developed later, where powerful labor movements could ally with rural constituencies, and economies heavily exposed to trade necessitated active state involvement in economic management.³⁷ ⁴⁶ ⁴⁷
In recent decades, all regime types have faced pressures from neoliberal ideology, which promoted austerity measures, privatization, and deregulation.²⁷ ⁴⁸ ⁴⁹ The extent of these reforms varied, however. Liberal regimes were most affected, particularly in contexts where organized labor had weakened and neoliberalism gained traction even within center-left parties.²⁷ ⁴⁸–⁵⁰ In settings where leftist parties retained greater political strength and benefitted from institutional path dependency, resistance to neoliberal restructuring was more pronounced.⁴⁴ ⁵¹ ⁵²
Research has consistently shown that welfare regime type is strongly linked to income distribution and poverty levels.²⁷ ³⁸ ³⁹ ⁴¹ ⁴² Social democratic and corporatist regimes generally exhibit lower poverty rates and more equitable income distributions compared to liberal regimes. Since the likelihood of food insecurity increases as income decreases,⁵³–⁵⁵ it follows that the type of welfare state regime may influence individuals’ risk of food insecurity. However, to date, this hypothesis has not been systematically tested.
In the present study, we apply the welfare state typology to internationally comparable, individual-level data on food insecurity. By examining the association between welfare regime type and the probability of experiencing food insecurity, this research extends the comparative welfare literature into a critical domain of public health. We hypothesize that individuals in social democratic and corporatist welfare regimes will face a lower risk of food insecurity than those in liberal regimes.
2. Method
2.1 Data Sources
The principal dataset for this study was derived from an international initiative measuring the prevalence of food insecurity across multiple nations.⁵⁶ Specifically, we utilized the Voices of the Hungry project, an undertaking of the Food and Agriculture Organization (FAO) of the United Nations. This program was established to track progress toward Sustainable Development Goal (SDG) 2.1.2, which aims for the eradication of hunger.⁵⁷ Through this initiative, nationally representative surveys of food insecurity are conducted with approximately 1,000 respondents per country in over 100 countries worldwide. These surveys are fielded as part of the Gallup World Poll, and the deidentified microdata are made publicly available for research purposes.⁵⁶
For the present analysis, our objective was to include 20 countries that could be reliably allocated into one of the three welfare state regime categories developed by Esping-Andersen and subsequent scholarship building on his framework: corporatist, liberal, or social democratic.²⁷ ³⁷ ⁴¹ ⁴² The countries initially targeted were: Australia, Austria, Belgium, Canada, Denmark, Finland, France, Germany, Ireland, Italy, Japan, the Netherlands, New Zealand, Norway, Portugal, Spain, Sweden, Switzerland, the United Kingdom, and the United States. A rationale for this selection is elaborated in the section on Welfare State Regimes.
Of these 20 countries, all except Canada and the United States had FAO Voices of the Hungry data available for 2017. For the United States, comparable data were accessed through the December supplement of the Current Population Survey conducted by the U.S. Census Bureau, which serves as the official data source for food security statistics.¹ ⁵⁸ With respect to Canada, we explored the Canadian Community Health Survey as a possible substitute.⁵⁹ However, the public use files from this survey lacked critical variables necessary for harmonization with FAO data, which made it unsuitable for inclusion. Consequently, Canada was excluded from the study.
Eligibility criteria mirrored those of the FAO survey, which includes individuals aged 15 years and older. We incorporated all available participants without exclusions. To align the U.S. Current Population Survey with FAO standards, respondents younger than 15 were excluded. Furthermore, as FAO datasets are capped at approximately 1,000 individuals per country, we randomly sampled 1,000 U.S. respondents using the sample function in R. This ensured comparability across all included countries. No additional exclusions were made.
All data used in the analysis corresponded to the year 2017, which represented the most recent point at which harmonized data were available across countries prior to the disruptive effects of the COVID-19 pandemic. Data analysis was conducted between November 2022 and June 2023. The Institutional Review Board at the University of North Carolina at Chapel Hill reviewed the study and concluded that the use of deidentified, publicly available data did not constitute human subjects research.
2.2 Welfare State Regimes
Our classification of welfare state regimes was grounded in Esping-Andersen’s seminal “three worlds” typology³⁷ and subsequent reinterpretations and reassessments developed in the decades since its publication.²⁷ We refined the categorization based on an extensive synthesis of scholarship critiquing and reinforcing this framework over the past thirty years.³⁶ ³⁸–⁴³ ⁴⁶ ⁶⁰ While fully acknowledging the methodological and conceptual criticisms levelled against Esping-Andersen’s approach, we elected to retain a three-category structure. This decision was motivated by a desire to maintain statistical power in comparative analyses and by the absence of a universally accepted alternative typology that has achieved widespread consensus. Because classification choices are inherently interpretive, we state our categorizations explicitly.
Based on our synthesis, countries were classified as follows:
- Corporatist regimes: Austria, Belgium, France, Germany, Italy, Japan, the Netherlands, Portugal, Spain, and Switzerland.
- Liberal regimes: Australia, Ireland, New Zealand, the United Kingdom, and the United States.
- Social Democratic regimes: Denmark, Finland, Norway, and Sweden.
This typology reflects an important methodological trade-off. On the one hand, the enduring value of welfare regime classifications has been demonstrated across three decades of scholarship. Despite legitimate criticisms and disagreements at the margins, there remains a substantive degree of consensus across various qualitative and quantitative efforts to operationalize these categories.²⁷ ³⁹ ⁴¹–⁴³ For this reason, we limited our analysis to a set of 19 countries for which the literature consistently supports their classification. On the other hand, several critiques merit attention. Notably, Bambra⁶⁰ and others have highlighted that Esping-Andersen’s framework exhibits a degree of gender-blindness, overlooking how welfare arrangements differently impact men and women. Additionally, because the typology is grounded in the historical and sociological trajectories of Northern and Western European states (and countries with close ties to them, such as Japan), it may not be easily applied to nations outside this context. Macro-level economic indicators alone are insufficient to permit accurate categorization in other regions.
Accordingly, we stress that our findings should be interpreted as relevant only to the selected set of countries. They may not be generalizable to welfare states with distinct historical, cultural, or institutional configurations beyond this group. This reflects a broader tension between internal and external validity. By focusing on a smaller number of relatively similar countries, we increase the validity of within-group comparisons and reduce the likelihood of confounding. However, this comes at the expense of generalizability across a more diverse set of global welfare states. Our emphasis here is on internal validity, which enhances the precision of comparative analysis while limiting external applicability.
Finally, our country selection also reflects a pragmatic consideration. As U.S.-based researchers, situating the analysis within a set of countries comparable to the United States provides findings with direct relevance for American policy debates. At the same time, the inclusion of European and other advanced welfare states allows for meaningful contrasts across regime types, thereby contributing to broader international scholarship.
2.3 Food Insecurity
Within the FAO dataset, food insecurity is evaluated using the eight-item Food Insecurity Experience Scale (FIES; 57,61,62). The FIES is a psychometrically validated tool designed to capture the latent construct of food insecurity. It relies on statistical frameworks from Item Response Theory, particularly Rasch modeling, to ensure consistency of measurement across different populations and time periods. To facilitate meaningful cross-national and cross-cultural comparisons, the FAO applies a Rasch model to each country’s annual data and then links the results to a unified global standard derived from pooled international data from 2014 to 2016. This procedure produces an estimate of the likelihood that any individual respondent is experiencing food insecurity, based on their survey responses.
Although food insecurity is often stratified into varying levels of severity, the present study concentrated on the probability of experiencing moderate or severe food insecurity. This specific threshold is consistent with the metric employed for monitoring progress toward the U.N. Sustainable Development Goal 2.1.2.63 In the case of the United States, data on food insecurity are collected using the Household Food Security Survey Module.1,55 While the instrument differs from the FIES, both are built upon item response theory principles, permitting comparability of results. The U.N.’s Voices of the Hungry initiative has previously developed statistical procedures that align scores from the Household Food Security Survey Module with the global reference standard, and we utilized these established conversion methods in the current analysis.61 Supplementary Table 2 provides additional details about this harmonization process.
2.4 Covariates
The central purpose of this research was to investigate the connection between welfare state configurations—systems that vary in how they redistribute income—and the risk of food insecurity. To disentangle the effects of income distribution from overall national wealth, our primary covariate was per capita gross domestic product (GDP). GDP values were standardized to 2017 dollars and adjusted across countries using purchasing power parity, ensuring comparability.
Beyond national wealth, we also accounted for a range of individual-level covariates available within the FAO dataset that could potentially shape both policy outcomes (and thereby welfare regime classifications) and vulnerability to food insecurity. These variables included: respondent age, gender (coded as male or female, as no other categories were captured in the dataset), and level of educational attainment (categorized as primary only, secondary, or tertiary/college and above). We further considered area of residence (urban versus rural), the number of adults aged 15 or older living in the household, and the number of children under 15 years of age present in the household. Equivalent measures were extracted from U.S. sources and harmonized with the FAO dataset to ensure consistency in the analysis.
2.5 Statistical Analysis
The principal outcome of interest was the predicted probability of experiencing moderate or severe food insecurity, estimated from Rasch models fitted separately for each country and year, and subsequently linked to the global standard. Unlike dichotomous categorizations that classify households as food secure or insecure, the probability measure better reflects the uncertainty inherent in quantifying a latent construct like food insecurity.
Our estimand of interest was the difference in, and secondarily the ratio of, the predicted probability of moderate or severe food insecurity across welfare regime categories. To evaluate these associations, we employed linear regression models. As a robustness check, fractional logistic regression was also performed. Beta regression was not feasible because in this dataset certain probabilities were effectively indistinguishable from zero.
Following model estimation, we calculated predictive margins to derive both risk differences and risk ratios in food insecurity probabilities across welfare state regimes. All statistical analyses incorporated representativeness weights included in the FAO data (or CPS data for the U.S.). These weights ensured representativeness at the national level, accounting for demographic distributions within countries. However, they were not designed to adjust for differences in population size across countries; consequently, each country contributed equally to the analysis, while individuals were differentially weighted within each country to reflect national populations.
To appropriately account for clustering in the data, standard errors were calculated at the country level, as the welfare regime operates at this level of treatment.64 All analyses were conducted using SAS version 9.4, Stata version 16.1, and R version 4.2.0. A two-tailed p-value of less than .05 was considered indicative of statistical significance.
3. Results
The study included 19,008 respondents from 19 different countries. Participants had an average age of 47.6 years (SD: 18.6), with women representing 51.3% of the sample. Liberal welfare states generally reported younger populations, higher levels of educational attainment, and a greater proportion of urban or suburban residents compared with corporatist and social democratic regimes (see Table 1). Across all countries, the average probability of an individual experiencing moderate or severe food insecurity was 0.067 (SD: 0.217) (Figure 1). When adjusting only for per capita GDP, significant differences in food insecurity risk emerged across welfare state regimes (see Table 2). Relative to liberal regimes, individuals in corporatist systems demonstrated lower probabilities of food insecurity (risk difference: −0.038, 95% CI −0.068 to −0.008, p = .01). A similar pattern was observed for social democratic systems, where individuals also faced a reduced probability (risk difference: −0.027, 95% CI −0.052 to −0.002, p = .03).
After incorporating additional covariates—age, gender, education, area of residence, household composition (number of adults and children), and per capita GDP—the differences remained robust. Compared with liberal regimes, individuals in corporatist systems had a significantly reduced probability of food insecurity (risk difference: −0.039, 95% CI −0.066 to −0.011, p = .006), as did those in social democratic regimes (risk difference: −0.037, 95% CI −0.062 to −0.012, p = .004). Using predictive margins,65 we further estimated how food insecurity probabilities might shift if liberal regimes were hypothetically restructured into corporatist or social democratic models while retaining their existing demographic and GDP profiles (Table 3). These simulations suggested substantial reductions in food insecurity risk. For instance, if the United States were to transition from its liberal welfare system to a social democratic model, the estimated mean probability of an individual experiencing moderate or severe food insecurity would decrease by nearly half—from 0.075 (95% CI 0.055 to 0.096) to 0.038 (95% CI 0.026 to 0.050). Finally, robustness checks using fractional logistic regression produced results closely aligned with the primary linear regression findings, confirming the stability of the observed associations.
Table 1: Participant Demographics by Welfare Regime (N = 19,008)
| Characteristic | Overall (N = 19,008) | Liberal (N = 5,004) | Corporatist (N = 10,004) | Social Democratic (N = 4,000) | p-value |
| Age, years (Mean, SD) | 47.58 (18.63) | 46.07 (18.86) | 47.92 (18.14) | 48.61 (19.41) | <.001 |
| Female, n (weighted %) | 9,866 (51.3) | 2,690 (51.4) | 5,159 (51.6) | 2,017 (50.2) | .429 |
| Education, n (weighted %) | <.001 | ||||
| Elementary or less | 2,105 (16.4) | 373 (8.6) | 1,377 (20.9) | 355 (14.9) | |
| Secondary | 10,447 (59.3) | 2,593 (59.3) | 5,616 (58.2) | 2,238 (62.0) | |
| College or greater | 6,354 (23.5) | 2,023 (31.6) | 2,966 (20.3) | 1,365 (21.4) | |
| Unknown | 102 (0.8) | 15 (0.5) | 45 (0.6) | 42 (1.7) | |
| Area of residence, n (weighted %) | <.001 | ||||
| Urban/Suburban | 8,870 (46.1) | 3,094 (62.6) | 4,142 (40.2) | 1,634 (40.0) | |
| Towns/Rural | 10,052 (53.5) | 1,877 (36.7) | 5,832 (59.5) | 2,343 (59.3) | |
| Unknown | 86 (0.5) | 33 (0.7) | 30 (0.3) | 23 (0.7) | |
| Number of adults in household, n (weighted %) | <.001 | ||||
| 1 | 4,810 (20.3) | 1,214 (15.7) | 2,258 (17.7) | 1,338 (32.5) | |
| 2 | 8,757 (44.2) | 2,293 (44.6) | 4,486 (42.9) | 1,978 (47.0) | |
| 3 | 3,086 (19.3) | 885 (21.7) | 1,770 (20.6) | 431 (12.9) | |
| 4 | 1,716 (11.9) | 433 (12.9) | 1,092 (13.8) | 191 (5.9) | |
| 5 | 458 (3.3) | 129 (3.8) | 289 (3.9) | 40 (1.1) | |
| 6 | 104 (0.8) | 30 (0.9) | 68 (0.9) | 6 (0.3) | |
| 7 | 22 (0.2) | 7 (0.3) | 14 (0.2) | 1 (0.0) | |
| 8 | 7 (0.1) | 2 (0.1) | 5 (0.1) | 0 (0.0) | |
| 9 | 0 (0.0) | 0 (0.0) | 0 (0.0) | 0 (0.0) | |
| 10+ | 9 (0.1) | 0 (0.0) | 3 (0.0) | 6 (0.2) | |
| Number of children in household, n (weighted %) | <.001 | ||||
| 0 | 14,507 (73.3) | 3,806 (70.6) | 7,525 (73.7) | 3,176 (75.5) | |
| 1 | 2,359 (13.9) | 614 (14.8) | 1,403 (14.9) | 342 (10.3) | |
| 2 | 1,537 (9.1) | 407 (10.0) | 798 (8.4) | 332 (9.5) | |
| 3 | 468 (3.0) | 130 (3.5) | 213 (2.4) | 125 (3.9) | |
| 4 | 86 (0.6) | 29 (0.9) | 39 (0.5) | 18 (0.6) | |
| 5 | 11 (0.1) | 5 (0.2) | 3 (0.0) | 3 (0.1) | |
| 6 | 7 (0.0) | 2 (0.0) | 5 (0.1) | 0 (0.0) | |
| 7 | 1 (0.0) | 0 (0.0) | 1 (0.0) | 0 (0.0) | |
| 8 | 2 (0.0) | 0 (0.0) | 0 (0.0) | 2 (0.1) | |
| 9 | 0 (0.0) | 0 (0.0) | 0 (0.0) | 0 (0.0) | |
| 10+ | 1 (0.0) | 0 (0.0) | 0 (0.0) | 1 (0.0) | |
| GDP per capita, PPP (2017 USD, Mean, SD) | 51,350.35 (10,596.93) | 54,930.92 (12,821.06) | 48,205.06 (9,778.31) | 54,731.40 (6,047.94) | <.001 |
Notes: P-values are derived from chi-squared or t-tests. All percentages are weighted, so they may not be directly calculated from the raw counts. Analyses included 19 countries using 2017 data and were conducted in 2023.
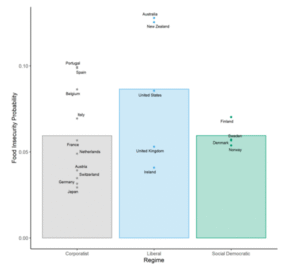
Figure 2: Probability of moderate or severe food insecurity by regime type Legend: mean probability of moderate or severe food insecurity by regime type (bars). Labelled dots represent the mean of each country within a given regime. Analyses include 19 countries
4. Discussion
This study, which examined the likelihood of food insecurity across 19 affluent democratic nations, demonstrates a strong relationship between the structure of a country’s social policies—its welfare regime—and the prevalence of food insecurity. Our analysis shows that individuals living within corporatist or social democratic systems faced significantly lower risks of food insecurity compared to those residing in liberal regimes. This association remained consistent even after accounting for differences in individual-level characteristics and adjusting for the GDP per capita of each country. Furthermore, our findings suggest that if liberal welfare regime nations were to shift toward corporatist or social democratic models, and if the observed associations reflect a causal mechanism, the probability of food insecurity in those contexts could be substantially reduced.
These results extend the evidence base established in prior research. Numerous studies have previously identified links between welfare state regimes and economic outcomes, particularly poverty rates across different national contexts.27,38,41,42 Similarly, investigations into specific policy domains, such as labor market regulations, have revealed meaningful associations with food insecurity.66 Other research focusing on total social expenditure—often referred to as “welfare effort”—has further documented that higher levels of social spending are correlated with reduced food insecurity prevalence.67 The current study builds upon these contributions by offering a more integrated assessment of the connection between national policy configurations, the allocation of resources, and the risks of food insecurity. By adopting a holistic approach, this work situates food insecurity not merely as an outcome of household characteristics or economic conditions but as a phenomenon shaped fundamentally by the institutional design of welfare states.
Table 2: Probability of Moderate or Severe Food Insecurity by Welfare State Regime
| Model | Regime | Mean Probability of Moderate or Severe Food Insecurity (95% CI) | Risk Difference (95% CI) | Risk Ratio (95% CI) | P-value |
| Adjusted only for GDP per capita | Liberal | 0.092 (0.066 to 0.119) | ref | ref | – |
| Corporatist | 0.054 (0.042 to 0.067) | −0.038 (−0.068 to −0.008) | 0.59 (0.40 to 0.86) | .01 | |
| Social Democratic | 0.065 (0.059 to 0.072) | −0.027 (−0.052 to −0.002) | 0.70 (0.54 to 0.93) | .03 | |
| Fully adjusted model | Liberal | 0.095 (0.070 to 0.119) | ref | ref | – |
| Corporatist | 0.056 (0.045 to 0.067) | −0.039 (−0.066 to −0.011) | 0.59 (0.42 to 0.83) | .006 | |
| Social Democratic | 0.057 (0.049 to 0.066) | −0.037 (−0.062 to −0.012) | 0.61 (0.46 to 0.81) | .004 |
Notes: GDP = gross domestic product. Fully adjusted model includes controls for age, gender, education, area, number of adults in household, number of children in household, and GDP per capita. P-value corresponds to the comparison of risk difference between liberal regimes and other regimes. Analyses cover 19 countries, used 2017 data, and were conducted in 2023.
One of the clearest implications of these findings is the policy relevance for liberal welfare states, most notably the United States. Our models indicate that if the U.S. or similar liberal regimes adopted corporatist or social democratic approaches, they would likely experience marked reductions in food insecurity. A striking real-world example comes from the 2021 expansion of the Child Tax Credit (CTC) in the U.S., which, although temporary, produced measurable declines in food hardship among households with children.68,69 The structural features of this reform—monthly disbursements and the removal of earnings thresholds—closely mirrored child benefit programs common in corporatist and social democratic regimes.70 This parallel reinforces the plausibility of our estimates and illustrates how incremental policy reforms grounded in alternative welfare logics can yield substantial improvements in food security.
Nonetheless, the applicability of these findings is not uniform across all contexts and warrants careful political and institutional consideration. The results are most directly relevant to liberal welfare states, including both the United States and the United Kingdom, where food insecurity remains pervasive despite recurring policy interventions.71 In the United States, many widely proposed reforms align with the liberal regime ethos, emphasizing stricter eligibility rules, tighter restrictions on benefit use, or greater reliance on private organizations and the health sector to address hunger.72–74 Such measures, however, often produce unintended effects, including increased administrative complexity, burdensome means-testing, and barriers that disproportionately affect the most vulnerable households.75 By contrast, policy frameworks rooted in principles of universalism, inclusivity, and public provision—characteristics central to social democratic regimes—may provide more effective guidance for long-term solutions.39,40
The implications of this study are also relevant for countries currently experiencing economic growth and seeking to broaden their welfare systems.47,76 For these states, our findings highlight how institutional design decisions during welfare state expansion can influence social outcomes such as food security. Rather than replicating the restrictive, targeted approaches of liberal regimes, emerging welfare states may benefit from adopting inclusive strategies modeled on corporatist or social democratic systems, thereby preventing entrenched food insecurity from becoming a persistent issue.
While this study adopted a holistic welfare regime framework, future research could profitably “unpack” this black box to identify the specific policy instruments or program designs most strongly associated with reductions in food insecurity. Differences within regimes also deserve attention. For instance, although Australia and Ireland are both categorized as liberal regimes, the average probability of food insecurity varies between them, suggesting internal heterogeneity. Likewise, evidence from corporatist systems points toward a Mediterranean or Southern sub-cluster—countries such as Spain and Portugal—where food insecurity risk is higher compared to Northern corporatist nations like Germany or Switzerland.27,77 These variations underscore the importance of examining within-regime diversity rather than treating regime categories as monolithic.
Table 3: Estimated Probability of Moderate or Severe Food Insecurity if Liberal Welfare States Adopted Corporatist or Social Democratic Policies
| Country | Liberal: Mean Probability (95% CI) | Estimated Probability if Corporatist (95% CI) | Estimated Probability if Social Democratic (95% CI) |
| Australia | 0.099 (0.073 to 0.124) | 0.060 (0.048 to 0.073) | 0.062 (0.051 to 0.072) |
| Ireland | 0.053 (0.033 to 0.072) | 0.014 (−0.007 to 0.036) | 0.016 (−0.003 to 0.034) |
| New Zealand | 0.111 (0.082 to 0.141) | 0.073 (0.059 to 0.087) | 0.074 (0.061 to 0.087) |
| United Kingdom | 0.096 (0.069 to 0.122) | 0.057 (0.047 to 0.067) | 0.058 (0.049 to 0.068) |
| United States | 0.075 (0.055 to 0.096) | 0.037 (0.023 to 0.050) | 0.038 (0.026 to 0.050) |
Notes: P-value for comparing liberal vs. corporatist regimes = 0.006; P-value for comparing liberal vs. social democratic regimes = 0.004. Since a linear model was used, these p-values are the same for all country-level comparisons between two regime types. The model was adjusted for age, gender, education, area, number of adults in household, number of children in household, and GDP per capita. Analyses include 19 countries, used data from 2017, and were conducted in 2023.
The results should, however, be interpreted with several limitations in mind. First, the typology employed in this analysis was restricted to a relatively narrow set of wealthy democratic states, predominantly located in Europe or sharing historical ties with the United Kingdom. Consequently, the findings may not be generalizable to other global contexts without careful adaptation. At the same time, the relative similarity among the included countries provides a methodological advantage by enhancing the validity of cross-country comparisons and reducing confounding due to vastly different economic or political systems. In other words, while external validity is limited, internal validity is strengthened.
Second, while welfare regime typologies are widely employed in comparative policy research, they ultimately represent pragmatic, simplified classifications. In reality, most countries incorporate elements from multiple welfare models, meaning that regime membership should be understood as fluid rather than absolute.27 Third, the U.S. data were derived from a different survey source than those used for other countries and relied on a distinct instrument to measure food insecurity. Although harmonization procedures were applied, residual measurement differences cannot be entirely ruled out.
Additionally, because this analysis relied on cross-sectional data, causal inferences cannot be directly established. While it is plausible that welfare state configurations influence food insecurity risks, the directionality of this relationship cannot be confirmed here. Longitudinal or quasi-experimental designs would be better suited to testing causality. Another limitation concerns the restricted set of individual-level covariates available in the harmonized dataset. For example, information on race and ethnicity was not included, despite strong evidence that structural racism and racial discrimination can significantly shape food insecurity risks. The absence of these factors limits the comprehensiveness of our models.
Despite these limitations, the study possesses notable strengths. It drew upon a large and diverse international dataset, applying harmonized measures of food insecurity based on a Rasch modeling framework to ensure cross-country comparability. Covariates were also standardized across countries within the same temporal window, reducing bias from inconsistent measurement. Furthermore, the analysis utilized an established typology of welfare regimes, which has proven explanatory value across multiple domains of social policy research. Importantly, this typology captures not only the magnitude of social spending but also the institutional logic guiding program design, providing richer insights than purely fiscal comparisons.
In summary, this study provides robust evidence that national welfare state regimes are significantly associated with individual-level risks of food insecurity. Liberal regimes, typified by targeted, means-tested benefits, appear less effective at reducing food insecurity compared to corporatist and social democratic systems, which emphasize inclusivity and universalism. For countries where food insecurity remains a pressing public health concern, considering policy principles drawn from alternative welfare regimes may prove beneficial. Ultimately, these findings highlight the importance of welfare state design in shaping population well-being and underscore the potential of social policy reforms to address the persistent challenge of food insecurity.
References
[1] Coleman-Jensen A, Rabbitt MP, Gregory CA, Singh A. Household food security in the United States in 2021. Accessed September 9, 2022. http://www.ers.usda.gov/publications/pub-details/?pubid=104655
[2] Gundersen C, Ziliak JP. Food insecurity and health outcomes. Health Aff Proj Hope. 2015;34(11):1830-1839. doi:10.1377/hlthaff.2015.0645
[3] Te Vazquez J, Feng SN, Orr CJ, Berkowitz SA. Food insecurity and cardiometabolic conditions: a review of recent research. Curr Nutr Rep. 2021;10(4):243-254. doi:10.1007/s13668-021-00364-2
[4] Berkowitz SA, Seligman HK, Meigs JB, Basu S. Food insecurity, healthcare utilization, and high cost: A longitudinal cohort study. Am J Manag Care. 2018;24(9):399-404.
[5] Berkowitz SA, Basu S, Meigs JB, Seligman HK. Food insecurity and health care expenditures in the United States, 2011-2013. Health Serv Res. 2018;53(3):1600-1620. doi:10.1111/1475-6773.12730
[6] Arenas DJ, Thomas A, Wang J, DeLisser HM. A systematic review and meta-analysis of depression, anxiety, and sleep disorders in US adults with food insecurity. J Gen Intern Med. 2019;34(12):2874-2882. doi:10.1007/s11606-019-05202-4
[7] Berkowitz SA, Berkowitz TSZ, Meigs JB, Wexler DJ. Trends in food insecurity for adults with cardiometabolic disease in the United States: 2005-2012. PloS One. 2017;12(6):e0179172. doi:10.1371/journal.pone.0179172
[8] Brandt EJ, Mozaffarian D, Leung CW, Berkowitz SA, Murthy VL. Diet and food and nutrition insecurity and cardiometabolic disease. Circ Res. 2023;132(12):1692-1706. doi:10.1161/CIRCRESAHA.123.322065
[9] Palakshappa D, Garg A, Peltz A, Wong CA, Cholera R, Berkowitz SA. Food insecurity was associated with greater family health care expenditures in the US, 2016–17. Health Aff Proj Hope. 2023;42(1):44-52. doi:10.1377/hlthaff.2022.00414
[10] Byhoff E, Guardado R, Xiao N, Nokes K, Garg A, Tripodis Y. Association of unmet social needs with chronic illness: A crosssectional study. Popul Health Manag. 2022;25(2):157-163. doi:10.1089/pop.2021.0351
[11] Byhoff E, Guardado R, Zack RM, Nokes K, Tripodis Y. A community partnership to reduce food insecurity and improve patient-reported depression. NEJM Catal Innov Care Deliv. 2023;4(2). doi:10.1056/CAT.22.0330
[12] Gundersen C, Tarasuk V, Cheng J, de Oliveira C, Kurdyak P. Food insecurity status andmortality among adultsin Ontario,Canada.PloS One. 2018;13(8):e0202642. doi:10.1371/journal.pone.0202642
[13] Tarasuk V, Cheng J, Oliveira C de, Dachner N, Gundersen C, Kurdyak P. Association between household food insecurity and annual health care costs. CMAJ. 2015;187(14):E429- E436. doi:10.1503/cmaj.150234
[14] Pilot S, Cohen R, Reach G, et al. Food insecurity in French patients with diabetes. Diabetes Metab. 2014;40(4):314-316. doi:10.1016/j.diabet.2014.02.005
[15] Campanera M, Gasull M, Gracia-Arnaiz M. Food security as a social determinant of health: Tackling inequalities in primary health care in Spain. Health Hum Rights. 2023;25(1):9-21.
[16] Gottlieb L, Fichtenberg C, Alderwick H, Adler N. Social determinants of health: What’s a healthcare system to do? J HealthcManag Am Coll Healthc Exec. 2019;64(4):243-257. doi:10.1097/JHM-D-18-00160
[17] Gottlieb LM, Wing H, Adler NE. A systematic review of interventions on patients’ social and economic needs. Am J PrevMed. 2017;53(5):719-729. Doi :10.1016/j.amepre.2017.05.011
[18]. De Marchis EH, Torres JM, Benesch T, et al. Interventions addressing food insecurity in health care settings: A systematic review. Ann Fam Med. 2019;17(5):436-447. doi:10.1370/afm.2412
[19]. Byhoff E, Kangovi S, Berkowitz SA, et al. A society of general internal medicine position statement on the internists’ role in social determinants of health. J Gen Intern Med. 2020;35(9):2721-2727. doi:10.1007/s11606-020-05934-8
[20]. Wu JH, Trieu K, Coyle D, et al. Testing the feasibility and dietary impact of a “produce prescription” program for adults with undermanaged type 2 diabetes and food insecurity in Australia. J Nutr. 2022;152(11):2409-2418. doi:10.1093/jn/nxac152
[21] Olstad DL, Beall R, Spackman E, et al. Healthy food prescription incentive programme for adults with type 2 diabetes who are experiencing food insecurity: Protocol for a randomised controlled trial, modelling and implementation studies. BMJ Open. 2022;12(2):e050006. doi:10.1136/bmjopen-2021-050006
[22] The Lancet Gastroenterology & Hepatology Editorial Board. Food insecurity in the UK: A public health issue left to fester. Lancet Gastroenterol Hepatol. 2022;7(7):585. doi:10.1016/S2468-1253(22)00178-9
[23] Food Aid and cost-of-living crisis in Europe. Red cross EU office. Published April 19, 2023. Accessed June 21, 2023. https://redcross.eu/latest-news/food-aid-and-cost-of-living-crisisin-europe
[24] Berkowitz SA. The logic of policies to address income-related health inequity: A problem-oriented approach. Milbank Q. 2022;100(2):370-392. doi:10.1111/1468-0009.12558
[25] Barr N. Economics of the Welfare State. Annotated ed. Oxford University Press;2020.
[26] Glennerster H. Understanding the Cost of Welfare. 3rd ed. Policy Press;2017.
[27] Kersbergen K van, Vis B. Comparative Welfare State Politics: Development, Opportunities, and Reform. Cambridge University Press;2013.
[28] Paetzold J. The convergence of welfare state indicators in Europe: Evidence from panel data. Eur J Soc Secur. 2013;15(1):28-54. doi:10.1177/138826271301500104
[29] Ferragina E, Seeleib-Kaiser M. Welfare regime debate: Past, present, futures? Policy Polit. 2011;39(4):583-611. doi:10.1332/030557311X603592
[30] Kammer A, Niehues J, Peichl A. Welfare regimes and welfare state outcomes in Europe. J Eur Soc Policy. 2012;22(5):455- 471. doi:10.1177/0958928712456572
[31] Papanicolas I, Woskie LR, Jha AK. Health care spending in the United States and other high-income countries. JAMA. 2018;319(10):1024-1039. doi:10.1001/jama.2018.1150
[32] Papanicolas I, Woskie LR, Orlander D, Orav EJ, Jha AK. The relationship between health spending and social spending in high-income countries: How does the US compare? Health Aff Proj Hope. 2019;38(9):1567-1575. doi:10.1377/hlthaff.2018.05187
[33] McCullough JM, Leider JP, Resnick B, Bishai D. Aligning US spending priorities using the health impact pyramid lens. Am J Public Health. 2020;110(S2):S181-S185. doi:10.2105/AJPH.2020.305645
[34] Rubin J, Taylor J, Krapels J, et al. Are Better Health Outcomes Related to Social Expenditure?: A Cross-National Empirical Analysis of Social Expenditure and Population Health Measures. RAND Corporation; 2016. Accessed February 7, 2023. https://www.rand.org/pubs/research_reports/RR1252.html
[35] Reynolds MM, Avendano M. Social policy expenditures and life expectancy in high-income countries. Am J Prev Med. 2018;54(1):72-79. doi:10.1016/j.amepre.2017.09.001
[36] Bambra C. In defence of (social) democracy: On health inequalities and the welfare state. J Epidemiol Community Health. 2013;67(9):713-714. doi:10.1136/jech-2013-202937
[37] Esping-Andersen G. The Three Worlds of Welfare Capitalism. Princeton University Press;1990.
[38] Brady D, Bostic A. Paradoxes of social policy: Welfare transfers, relative poverty, and redistribution preferences. Am Sociol Rev. 2015;80(2):268-298. doi:10.1177/0003122415573049
[39] Jacques O, Noël A. Targeting within universalism. J Eur Soc Policy. 2021;31(1):15-29. doi:10.1177/0958928720918973
[40] Anttonen A, Sipilä J. Universalism in the British and Scandinavian social policy debates. In: Welfare State, Universalism and Diversity. Edward Elgar Publishing; 2012:16-41. doi:10.4337/9781849803830.00007
[41] Gugushvili D, Laenen T. Two decades after Korpi and Palme’s “paradox of redistribution”: What have we learned so far and where do we take it from here? J Int Comp Soc Policy. 2021;37(2):112-127. doi:10.1017/ics.2020.24
[42] Korpi W, Palme J. The paradox of redistribution and strategies of equality: Welfare state institutions, inequality, and poverty in the Western Countries. Am Sociol Rev. 1998;63(5):661-687.doi:10.2307/2657333
[43] Brady D. Rich Democracies, Poor People: How Politics Explain Poverty. Illustrated edition. Oxford University Press;2009.
[44] Rothstein B. Just Institutions Matter: The Moral and Political Logic of the Universal Welfare State. Illustrated edition. Cambridge University Press;1998.
[45] Berkowitz SA, Palakshappa D. Gaps in the welfare state: A role-based model of poverty risk in the U.S. PloS One. 2023;18(4):e0284251. doi:10.1371/journal.pone.0284251
[46] Rice D. Beyond welfare regimes: From empirical typology to conceptual ideal types. Soc Policy Adm. 2013;47(1):93-110. doi:10.1111/spol.12001
[47] Wilensky HL. Rich democracies: political economy, public policy, and performance. 2002.
[48] Harvey D. A Brief History of Neoliberalism. Oxford University Press;2007.
[49] Stuckler D, Reeves A, Loopstra R, Karanikolos M, McKee M. Austerity and health: The impact in the UK and Europe. Eur J Public Health. 2017;27(suppl_4):18-21. doi:10.1093/eurpub/ckx167
[50] Burmila E. Chaotic Neutral: How the Democrats Lost Their Soul in the Center. Bold Type Books;2022.
[51] Jordan J. Policy feedback and support for the welfare state. J Eur Soc Policy. 2013;23(2):134-148. doi:10.1177/0958928712471224
[52] Lynch J. Regimes of Inequality. Cambridge University Press;2021.
[53] Bartfeld J, Men F. Food insecurity among households with children: The role of the state economic and policy context. Soc Serv Rev. 2017;91(4):691-732. doi:10.1086/695328
[54] Bartfeld J, Dunifon R, Nord M, Carlson S. What factors account for state-to-state differences in food security? Accessed September 25, 2018. https://www.ers.usda.gov/publications/pub-details/?pubid=44133
[55] Bickel G, Nord M, Price C, Hamilton W, Cook J. Guide to measuring household food security, revised 2000. Published online March 2000. Accessed September 17, 2018. https://fns-prod.azureedge.net/sites/default/files/FSGuide.pdf
[56] Food and Agriculture Organization of the United Nations. Food and agriculture data catalog. Accessed February 8, 2023. https://microdata.fao.org/index.php/catalog/Food-Security/?page=1&sort_by=popularity&sort_order=desc&ps=15&repo=Food-Security
[57] Food and Agriculture Organization of the United Nations. Voices of the hungry. Accessed February 8, 2023. https://www.fao.org/in-action/voices-of-the-hungry/background/en/
[58] US Census Bureau. Current population survey datasets. Census.gov. Accessed February 8, 2023. https://www.census.gov/programs-surveys/cps/data/datasets.html
[59] Statistics Canada. Canadian community health survey – annual component (CCHS). Accessed February 8, 2023. https://www.statcan.gc.ca/en/survey/household/3226
[60] Bambra C. Going beyond the three worlds of welfare capitalism: Regime theory and public health research. J Epidemiol Community Health. 2007;61(12):1098-1102. doi:10.1136/jech.2007.064295
[61] Food and Agriculture Organization of the United Nations. Analyse the Data | Voices of the Hungry | Food and Agriculture Organization of the United Nations. Accessed February 8, 2023. https://www.fao.org/in-action/voices-of-thehungry/analyse-data/en/
[62] Nord M, Statistics Division. Introduction to Item Response Theory Applied to Food Security Measurement: Basic Concepts, Parameters and Statistics. FAO;2014. Accessed July 15, 2021. http://www.fao.org/publications/card/en/c/577f6a79-9cbd-49f5-b606-500ea42bf88e/
[63] Food and Agriculture Organization of the United Nations. SDG 2. Zero hunger | Sustainable Development Goals. Accessed February 8, 2023. https://www.fao.org/sustainable-developmentgoals/goals/goal-2/en/
[64] Abadie A, Athey S, Imbens GW, Wooldridge JM. When should you adjust standard errors for clustering?*. Q J Econ. 2023;138(1):1-35. doi:10.1093/qje/qjac038
[65] Graubard BI, Korn EL. Predictive margins with survey data. Biometrics. 1999;55(2):652-659. doi:10.1111/j.0006-341x.1999.00652.x
[66] Reeves A, Loopstra R, Tarasuk V. Wage-setting policies, employment, and food insecurity: A multilevel analysis of 492,078 people in 139 countries. Am J Public Health. 2021;111(4):718-725. doi:10.2105/AJPH.2020.306096
[67] Hossain MB, Long MA, Stretesky PB. Welfare state spending, income inequality and food insecurity in affluent nations: A cross-national examination of OECD countries. Sustainability. 2021;13(1):324. doi:10.3390/su13010324
[68] Bovell-Ammon A, McCann NC, Mulugeta M, Ettinger de Cuba S, Raifman J, Shafer P. Association of the expiration of child tax credit advance payments with food insufficiency in US households. JAMA Netw Open. 2022;5(10):e2234438. doi:10.1001/jamanetworkopen.2022.34438
[69] Adams E, Brickhouse T, Dugger R, Bean M. Patterns of food security and dietary intake during the first half of the child tax credit expansion. Health Aff Proj Hope. 2022;41(5):680- 688. doi:10.1377/hlthaff.2021.01864
[70] Berkowitz SA, Orr CJ, Palakshappa D. The public health case for a universalist child tax credit. JAMA Pediatr. 2022;176(9):843-844. doi:10.1001/jamapediatrics.2022.2503
[71] Berg J, Gibson A. Why the world should not follow the failed United States model of fighting domestic hunger. Int J Environ Res Public Health. 2022;19(2):814. doi:10.3390/ijerph19020814
[72] Bleich SN, Moran AJ, Vercammen KA, et al. Strengthening the public health impacts of the supplemental nutrition assistance program through policy. Annu Rev Public Health. 2020; 41:453-480. doi:10.1146/annurev-publhealth-040119-094143
[73] Unrath M. Targeting, screening, and retention: evidence from California’s food stamps program. Accessed February 9, 2021. https://www.capolicylab.org/wp-content/uploads/2021/02/CalFresh-Working-Paper.pdf
[74] Himmelstein DU, Woolhandler S. Corporate efforts to adopt and distort the social determinants of health framework. Int J Soc Determinants Health Health Serv. 2023;53(3): 249-252.doi:10.1177/27551938231162573
[75] Herd P, Moynihan DP. Administrative Burden: Policymaking by Other Means. 1st ed. Russell Sage Foundation;2019.
[76] Lindert PH. Making Social Spending Work. Cambridge University Press; 2021.
[77] Gal J. Is there an extended family of Mediterranean welfare states? J Eur Soc Policy. 2010;20(4):283-300. doi:10.1177/0958928710374374